-
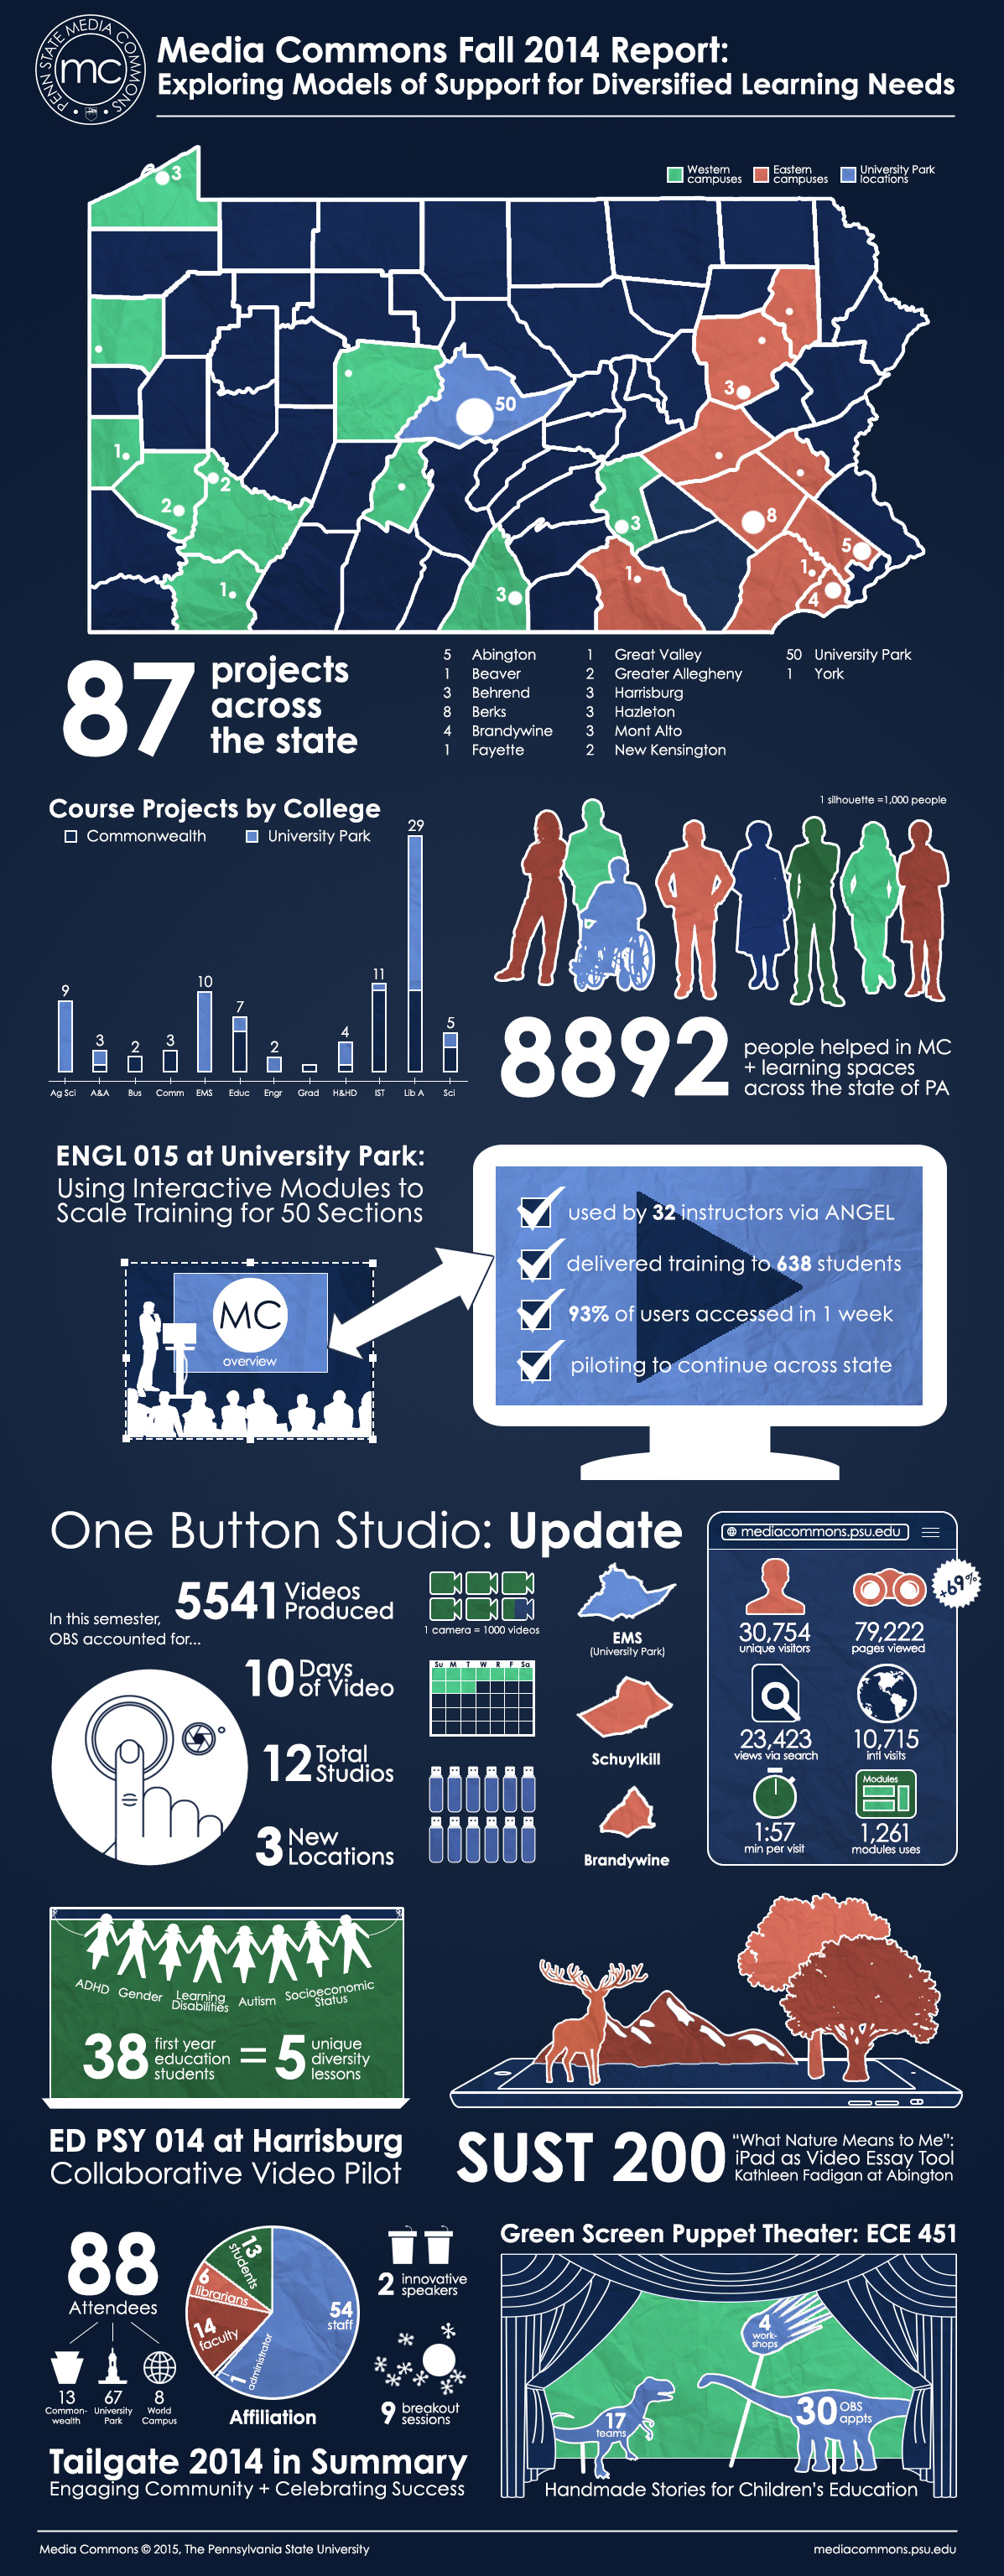
 Fall 2024 Infographic
-
 Spring 2024 Infographic
-
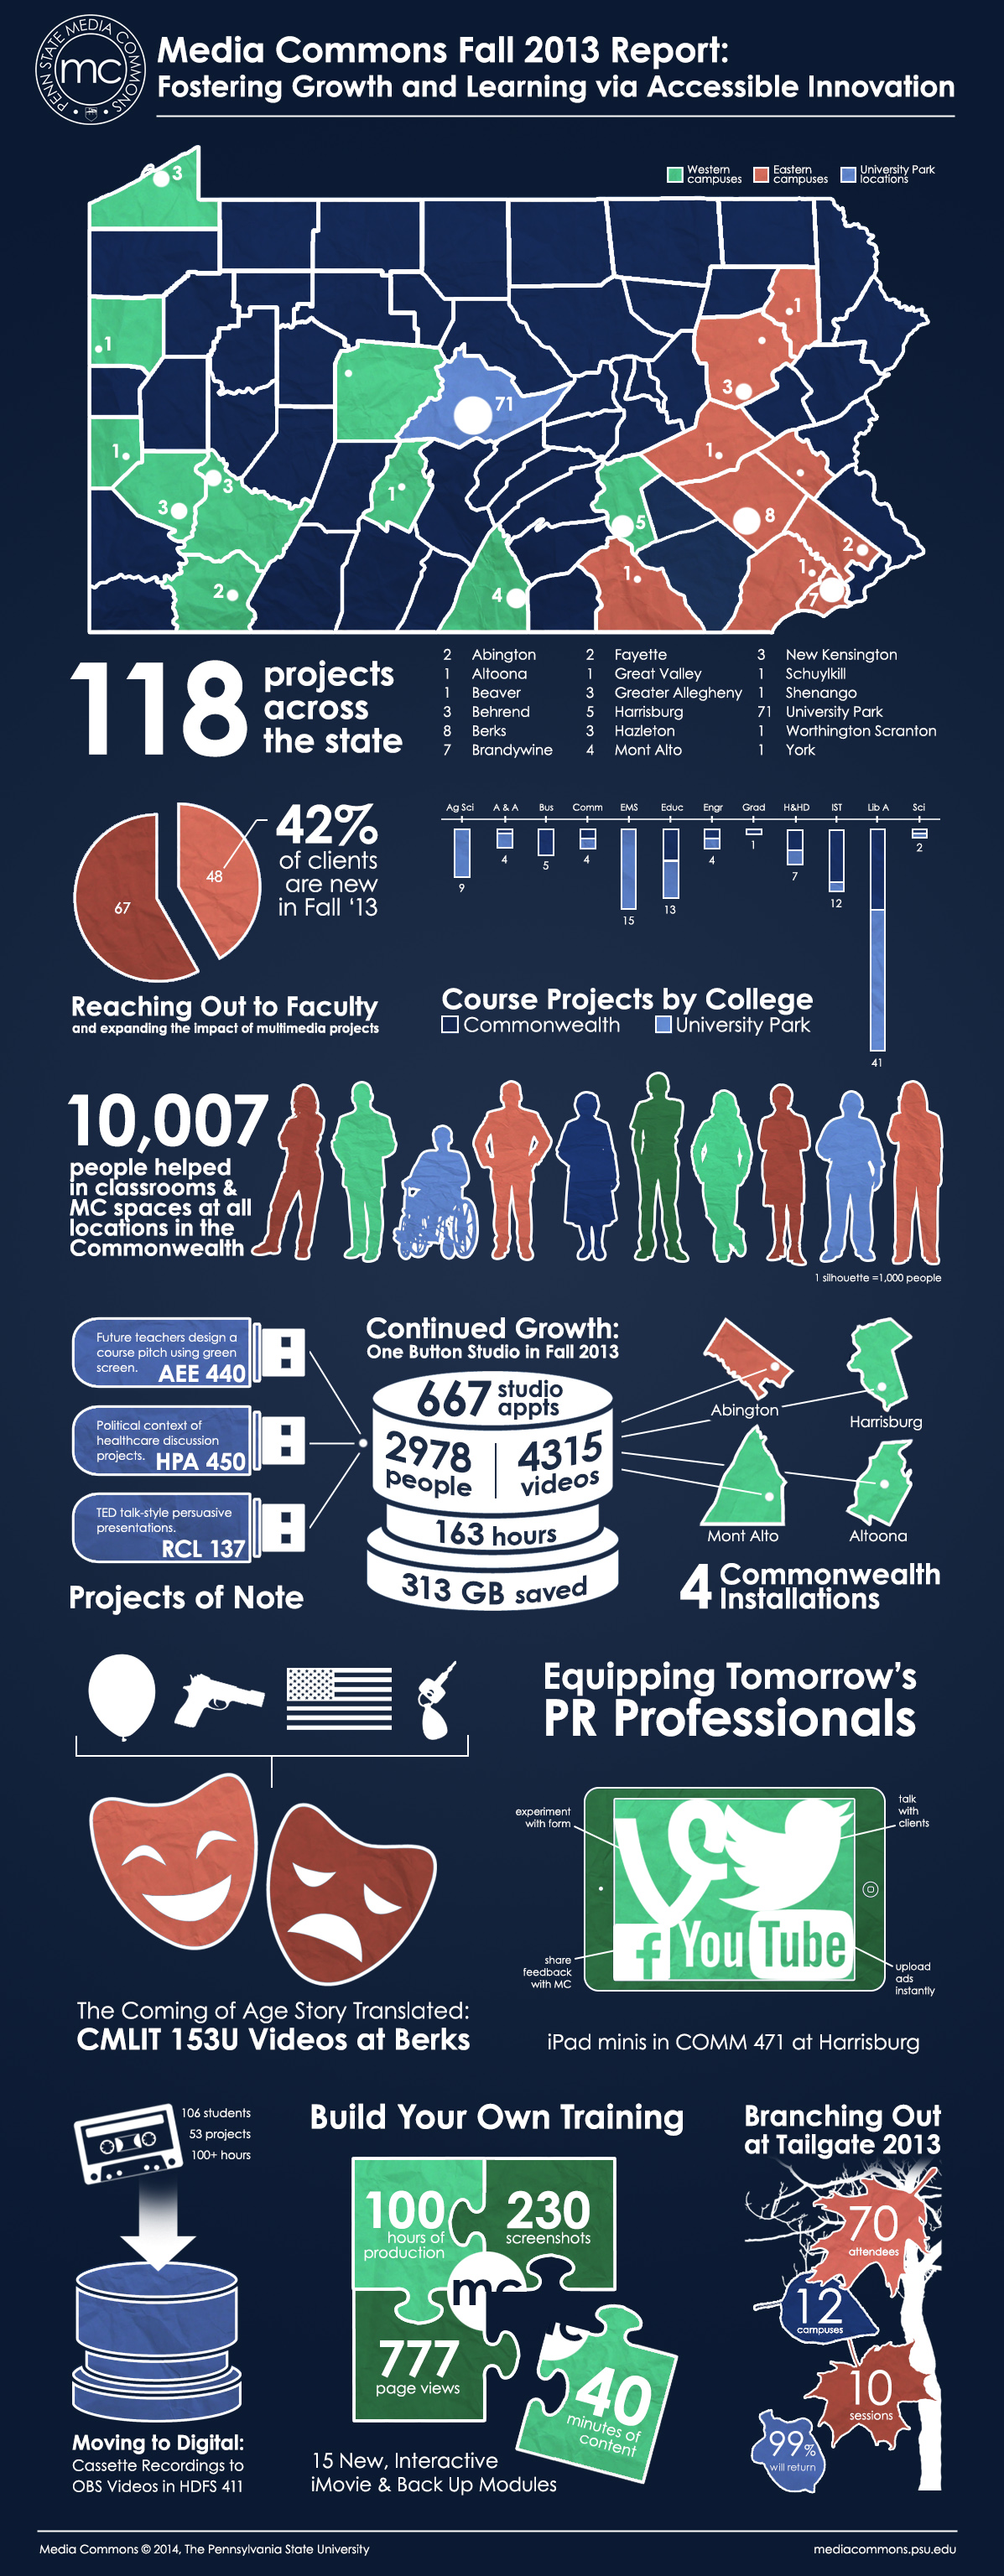
 Fall 2023 Infographic
-
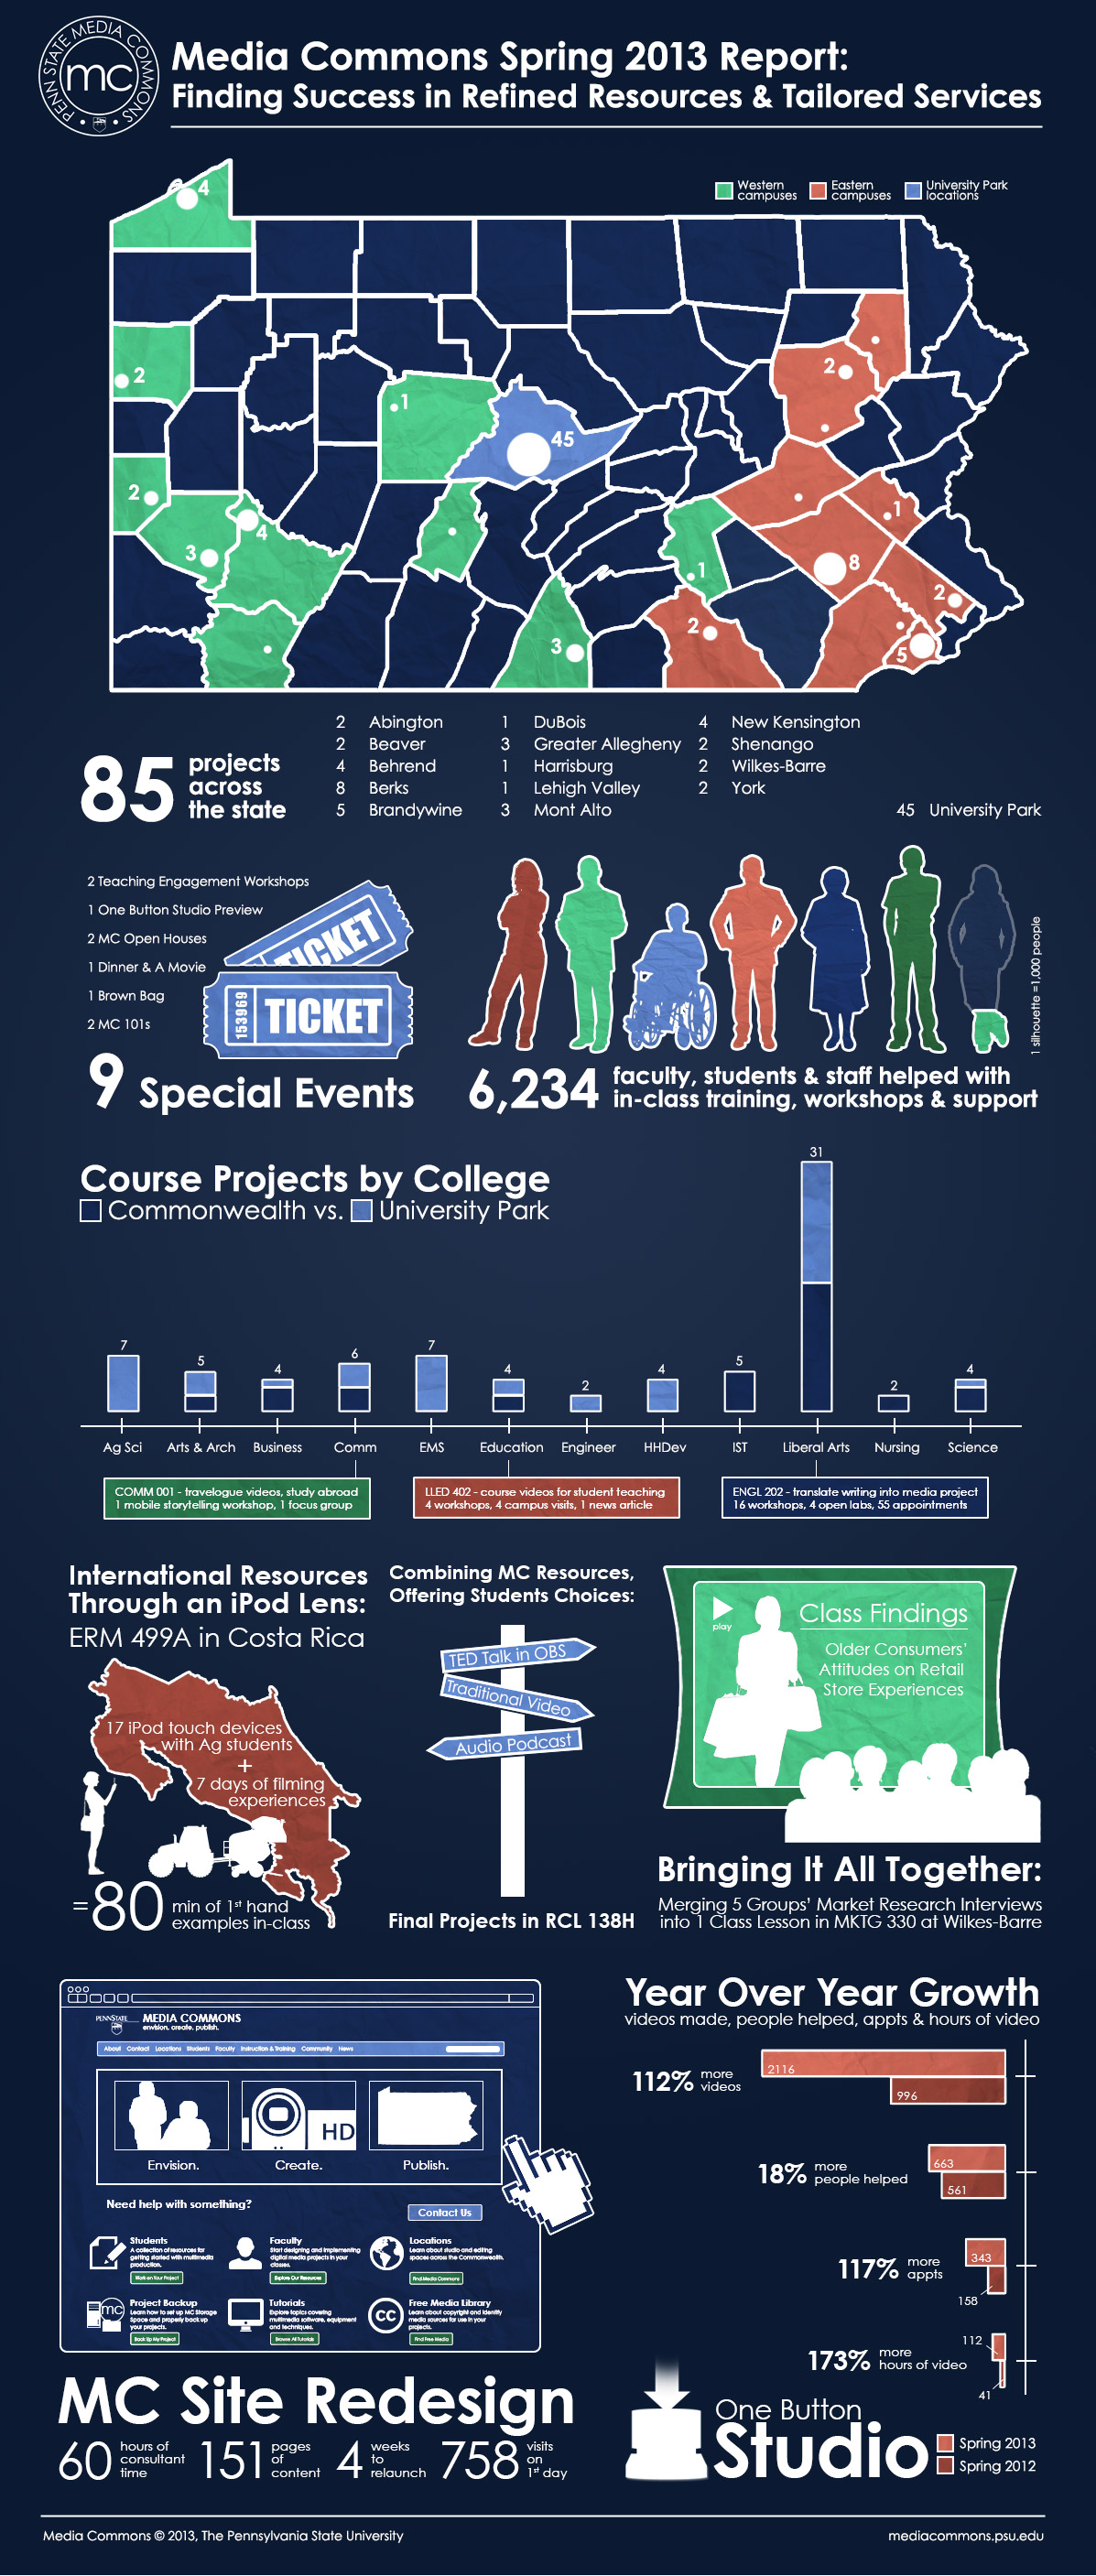
 Spring 2023 Infographic
-
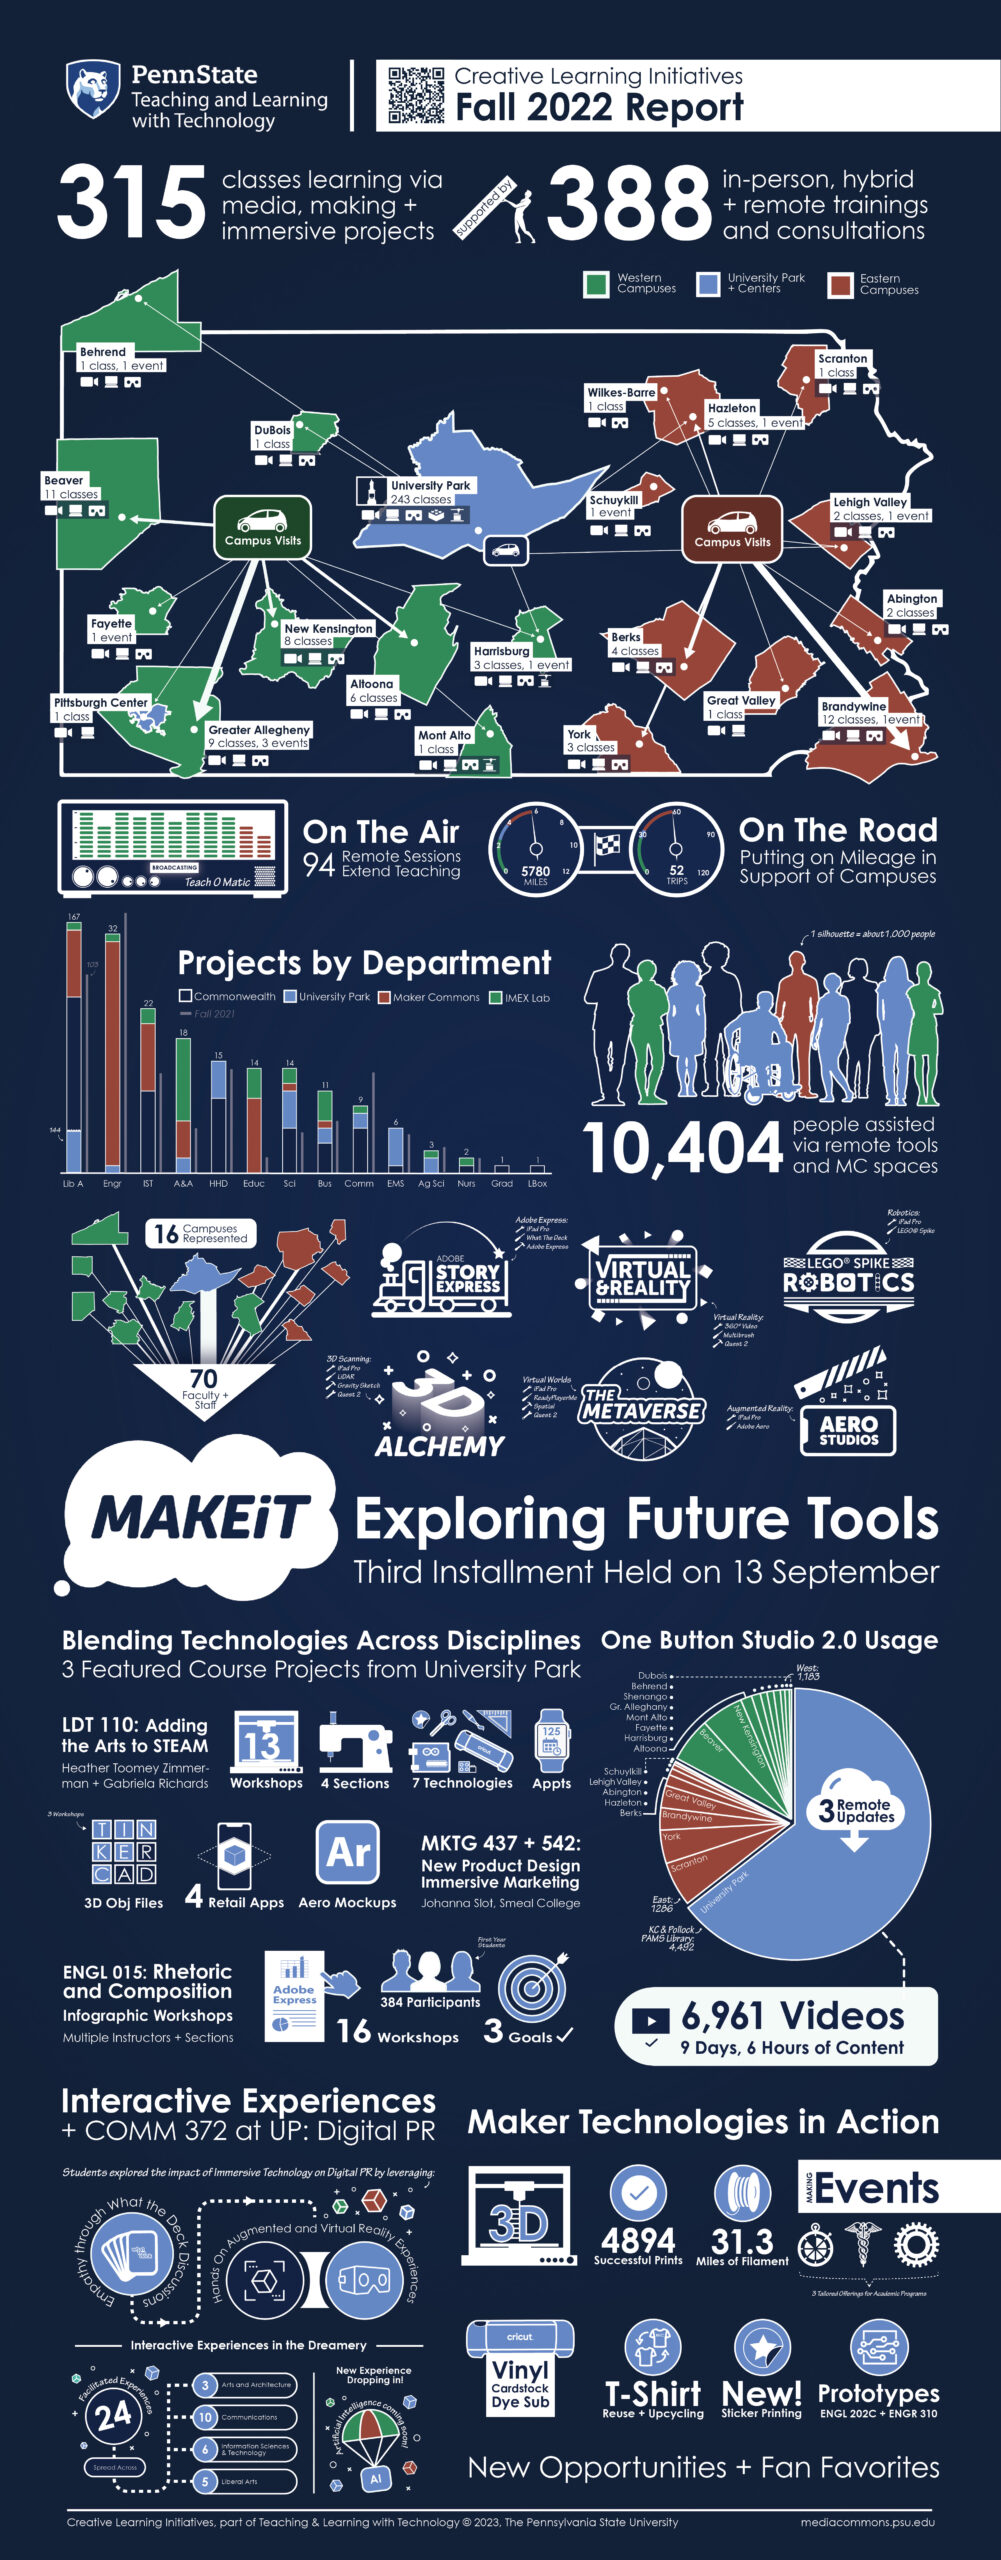 Fall 2022 Infographic
-
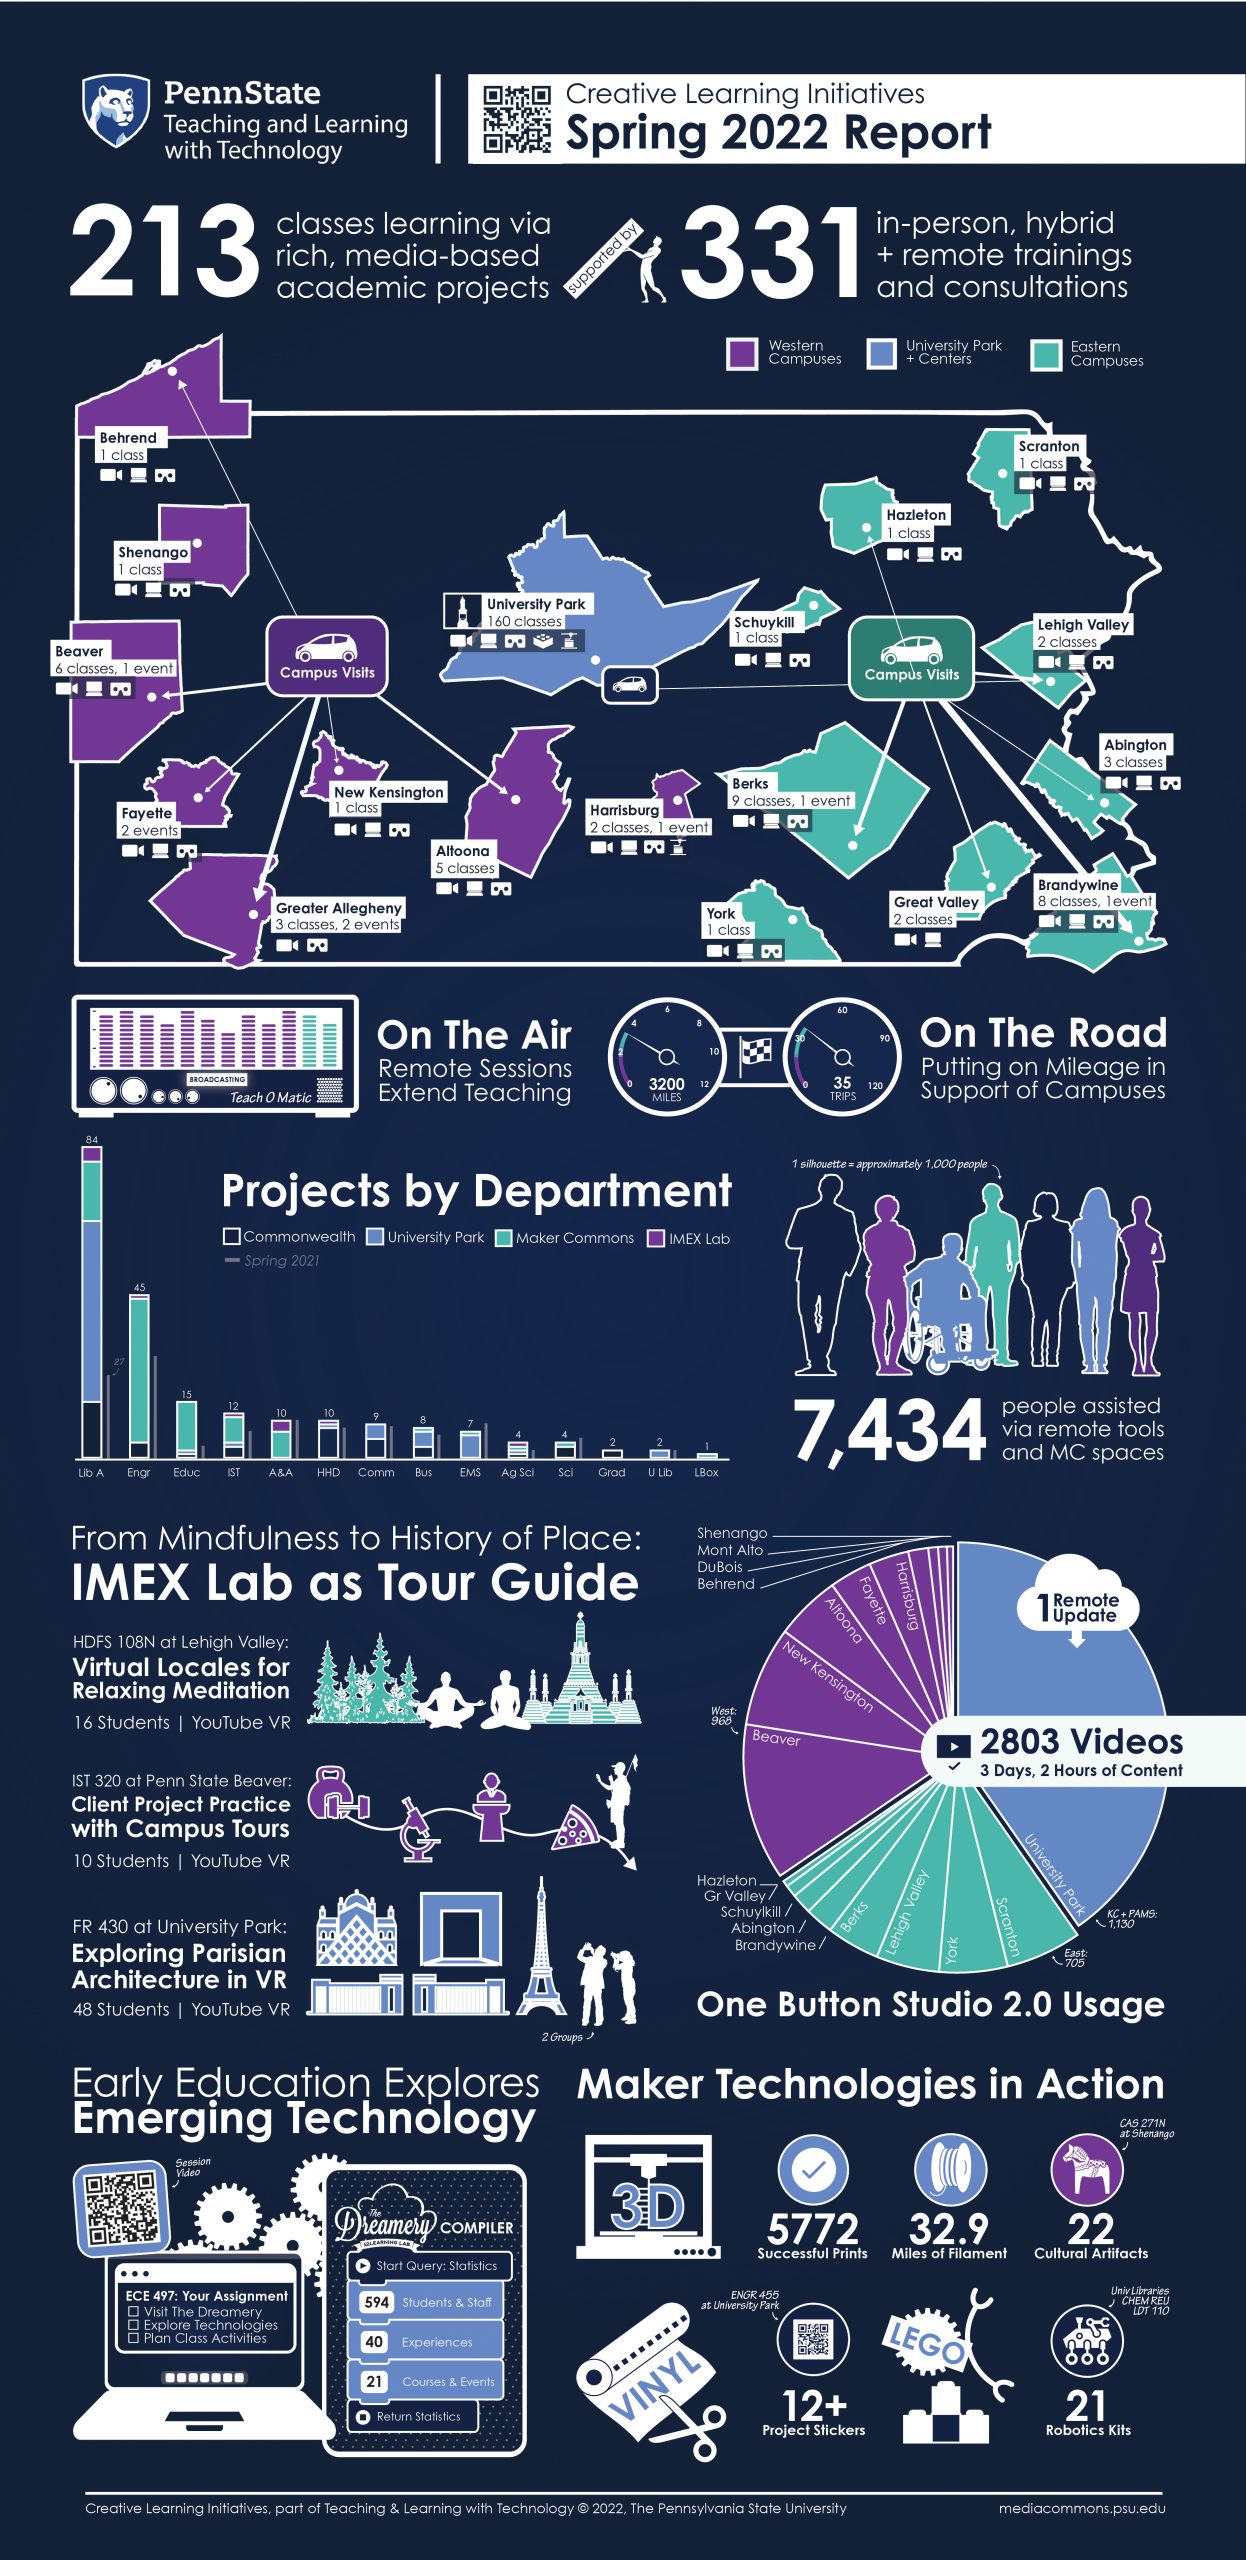 Spring 2022 Infograpic
-
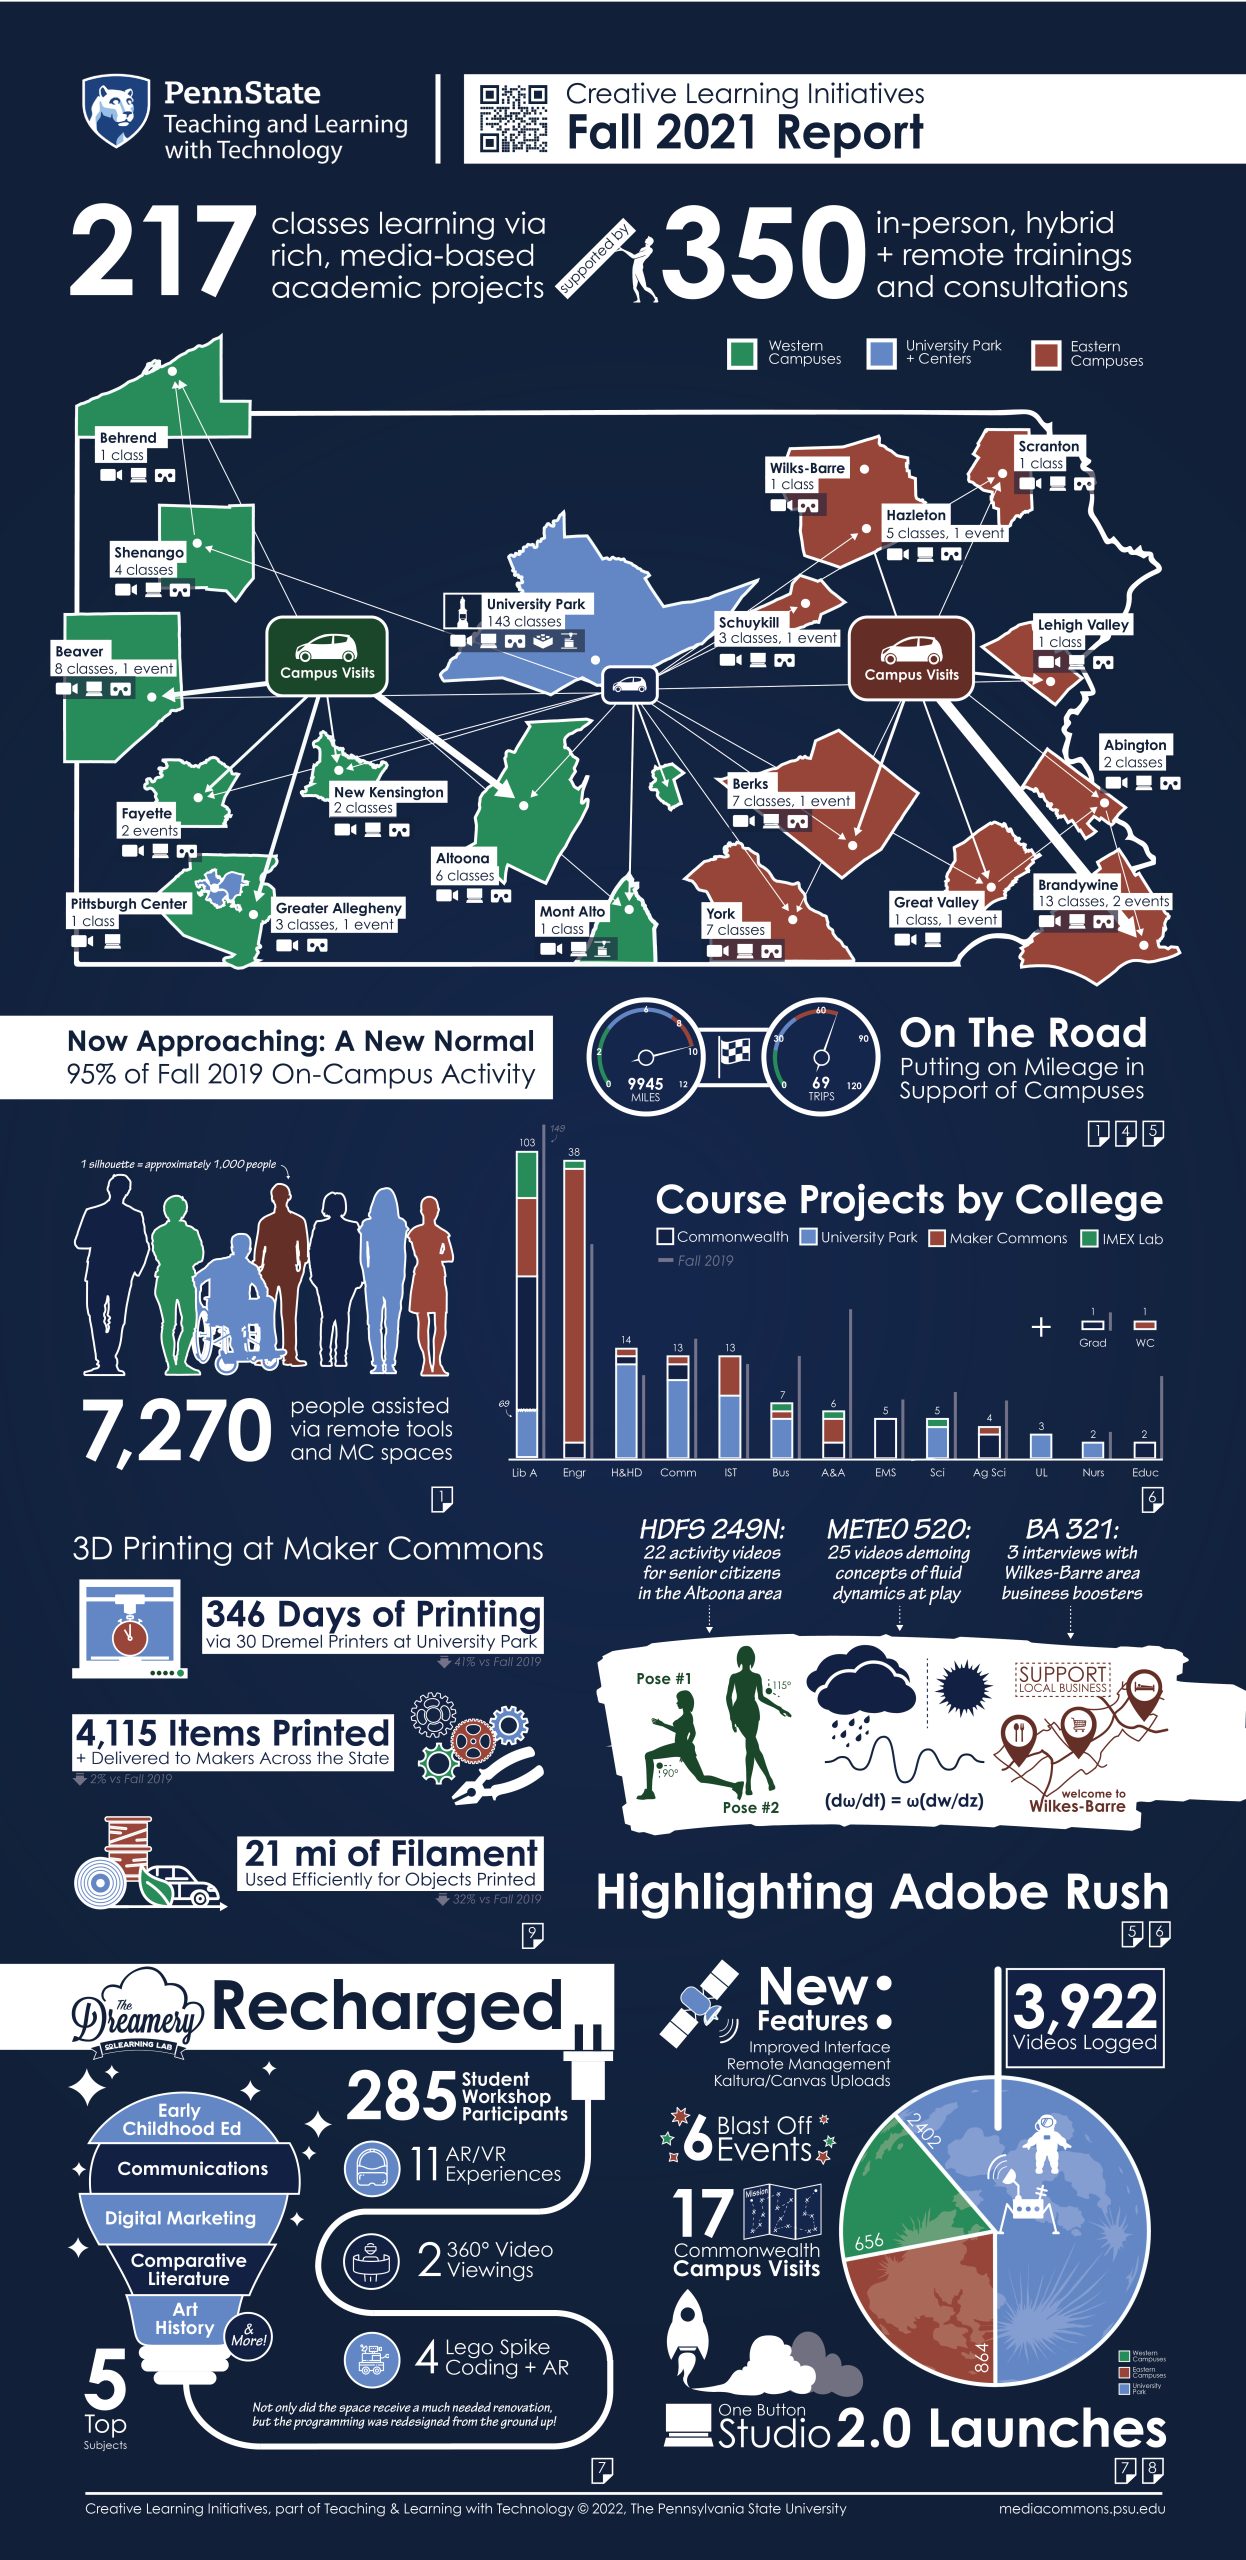 Fall 2021 Infographic
-
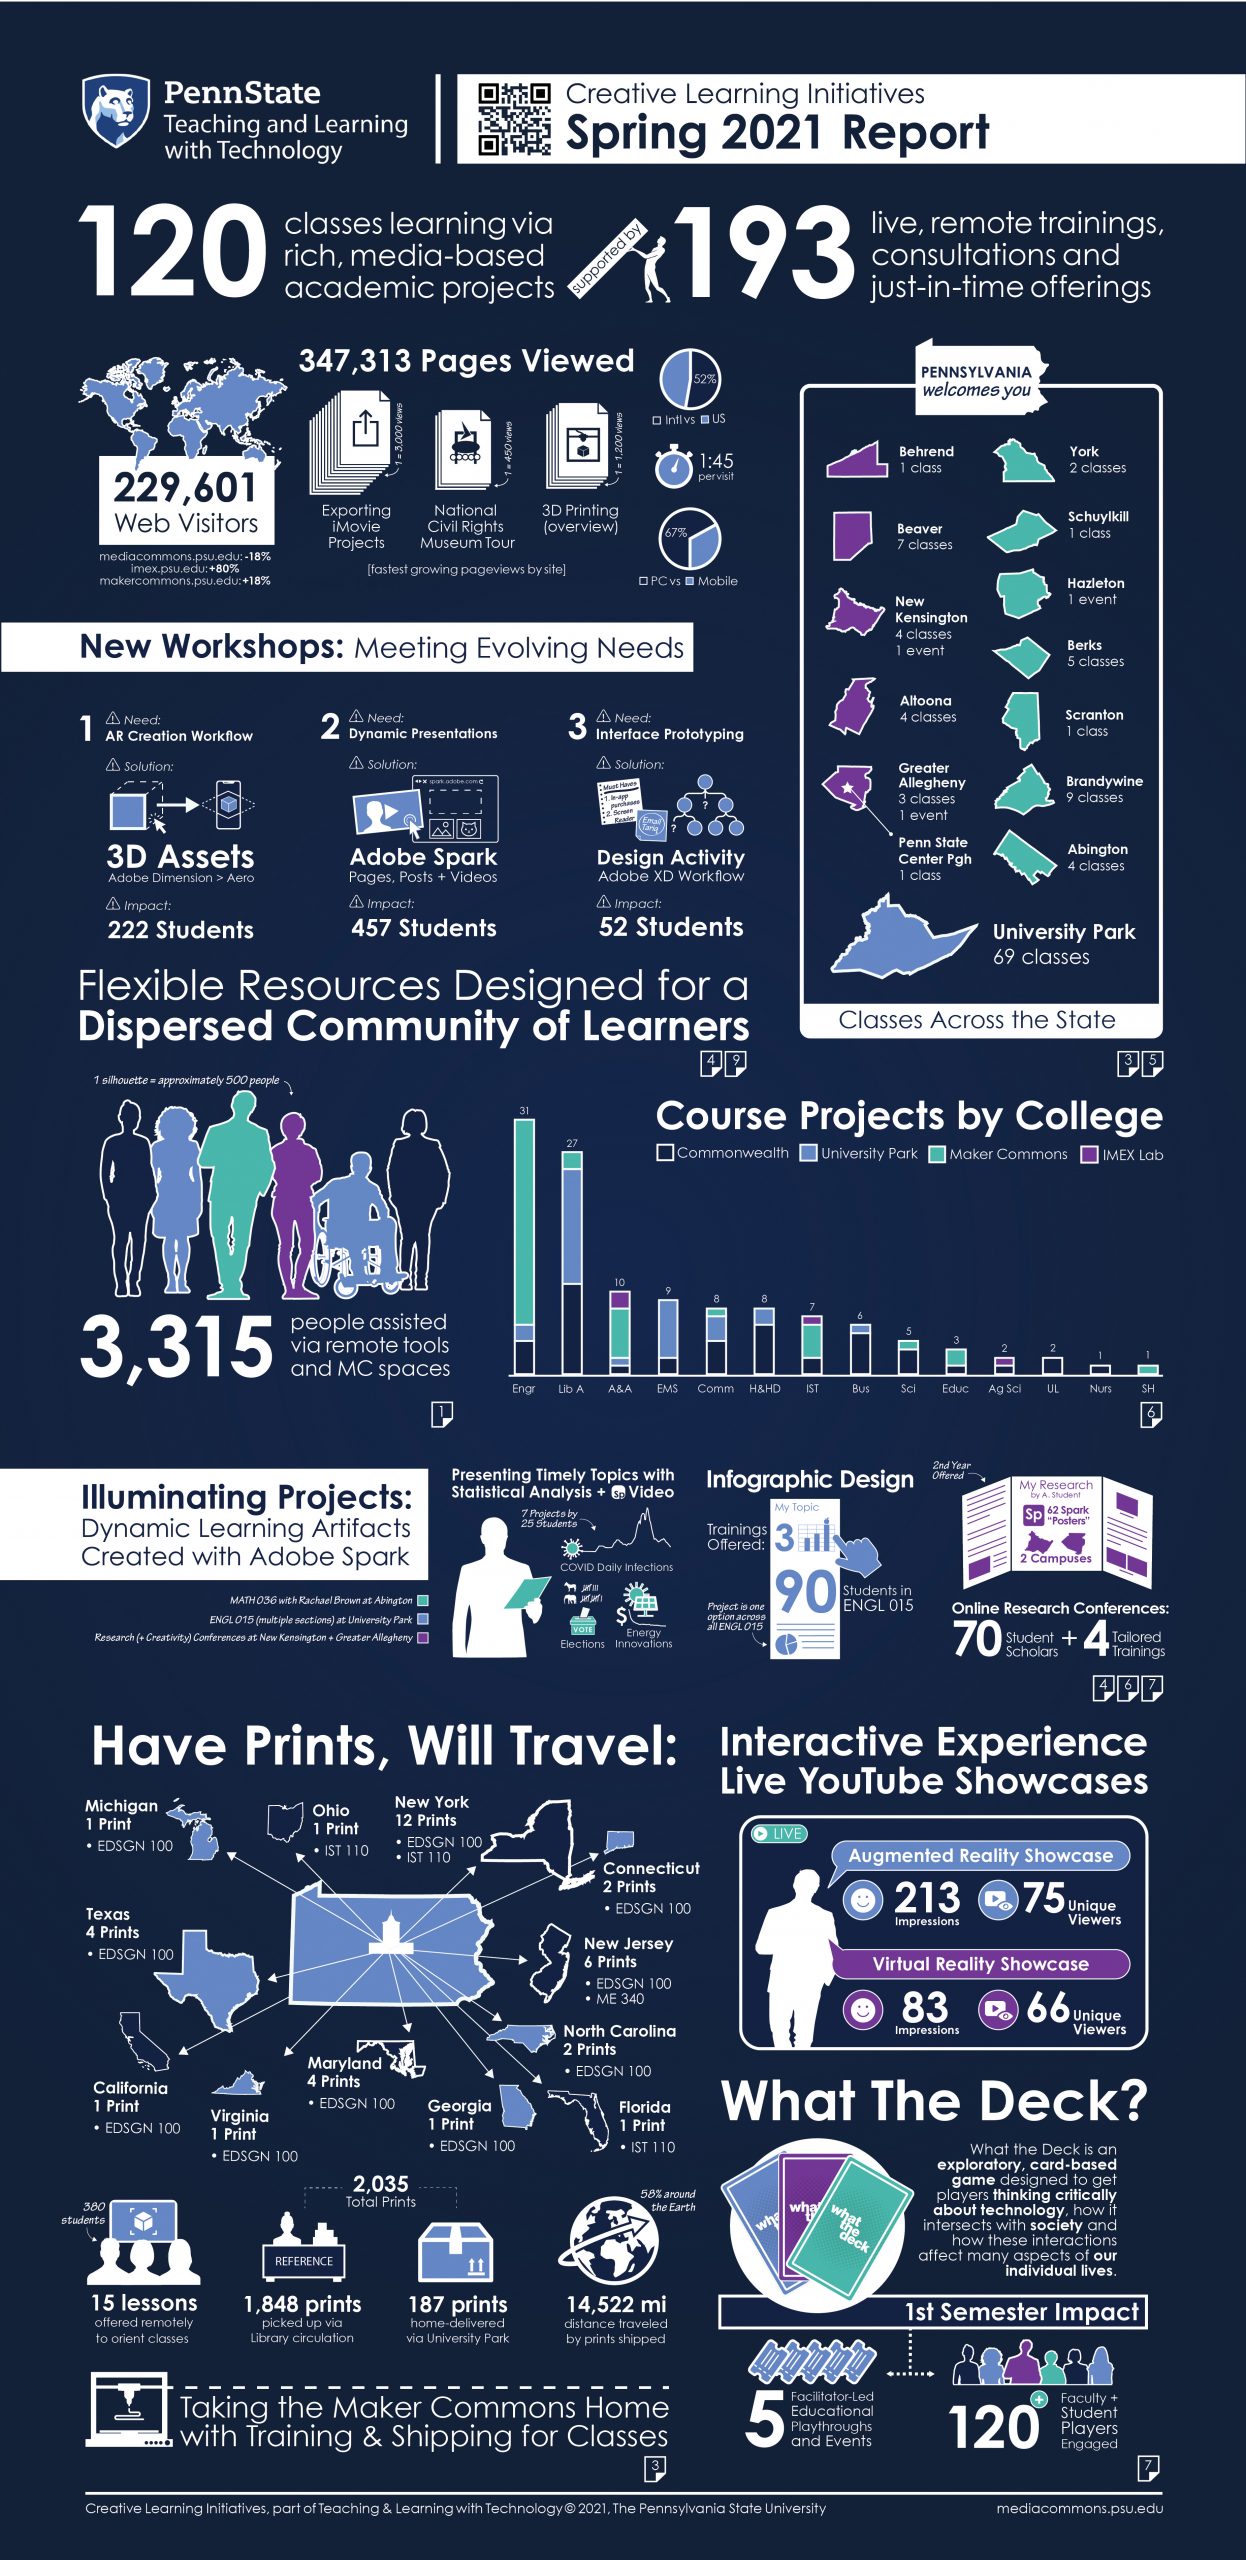 Spring 2021 Infographic
-
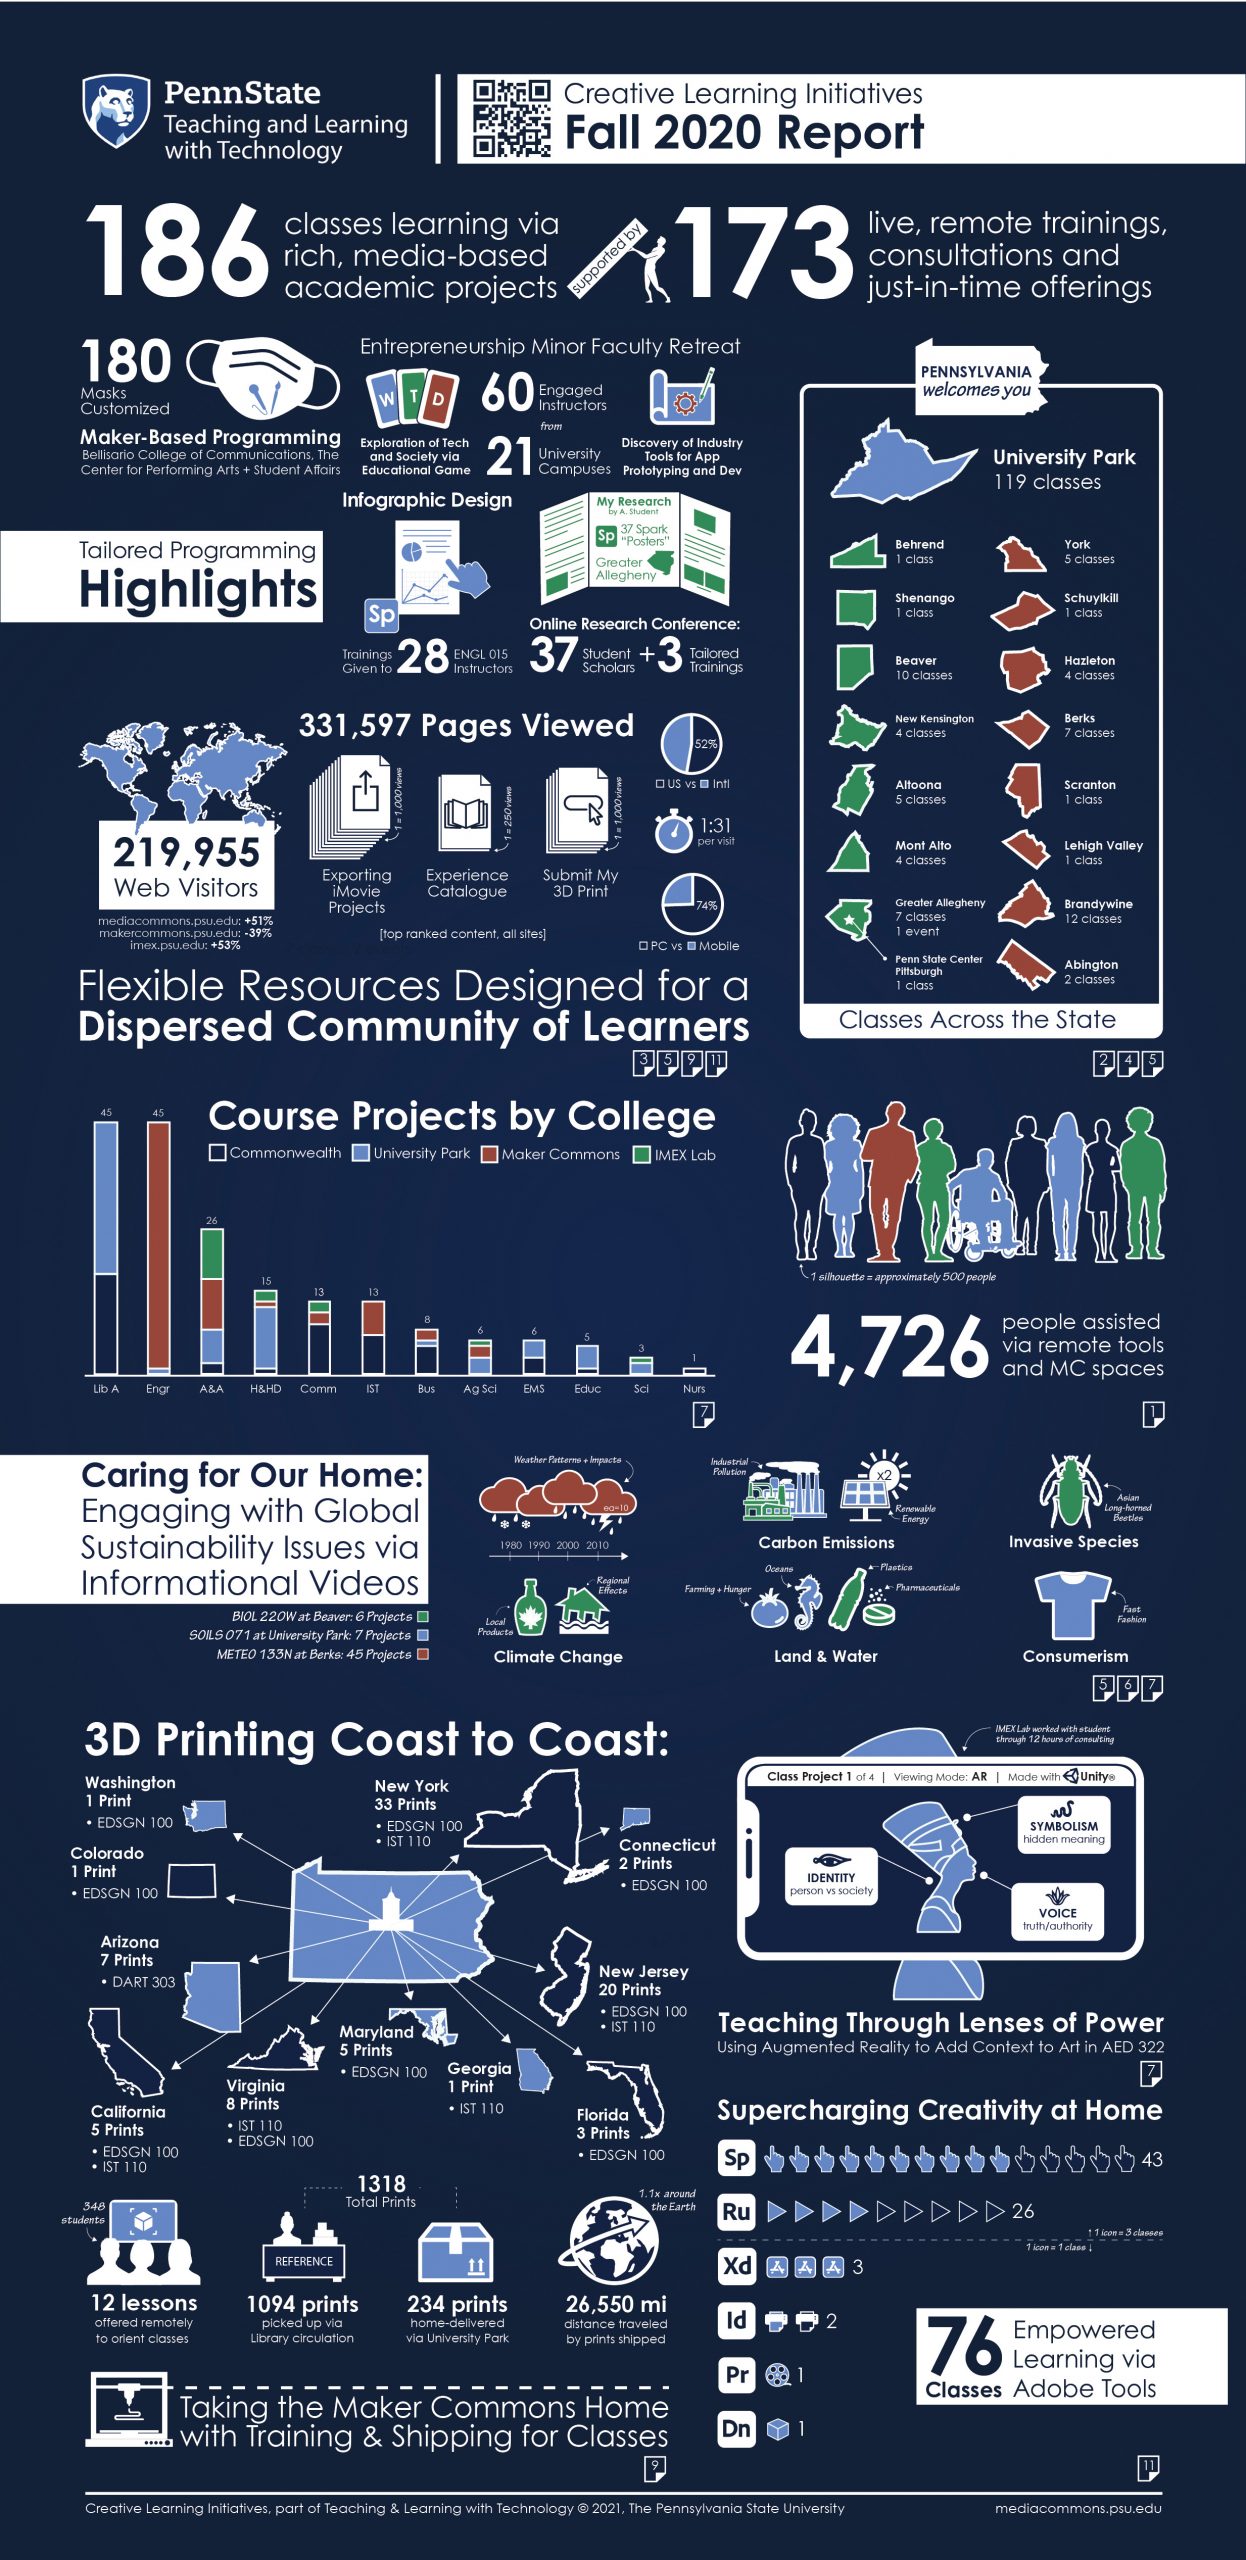 Fall 2020 Infographic
-
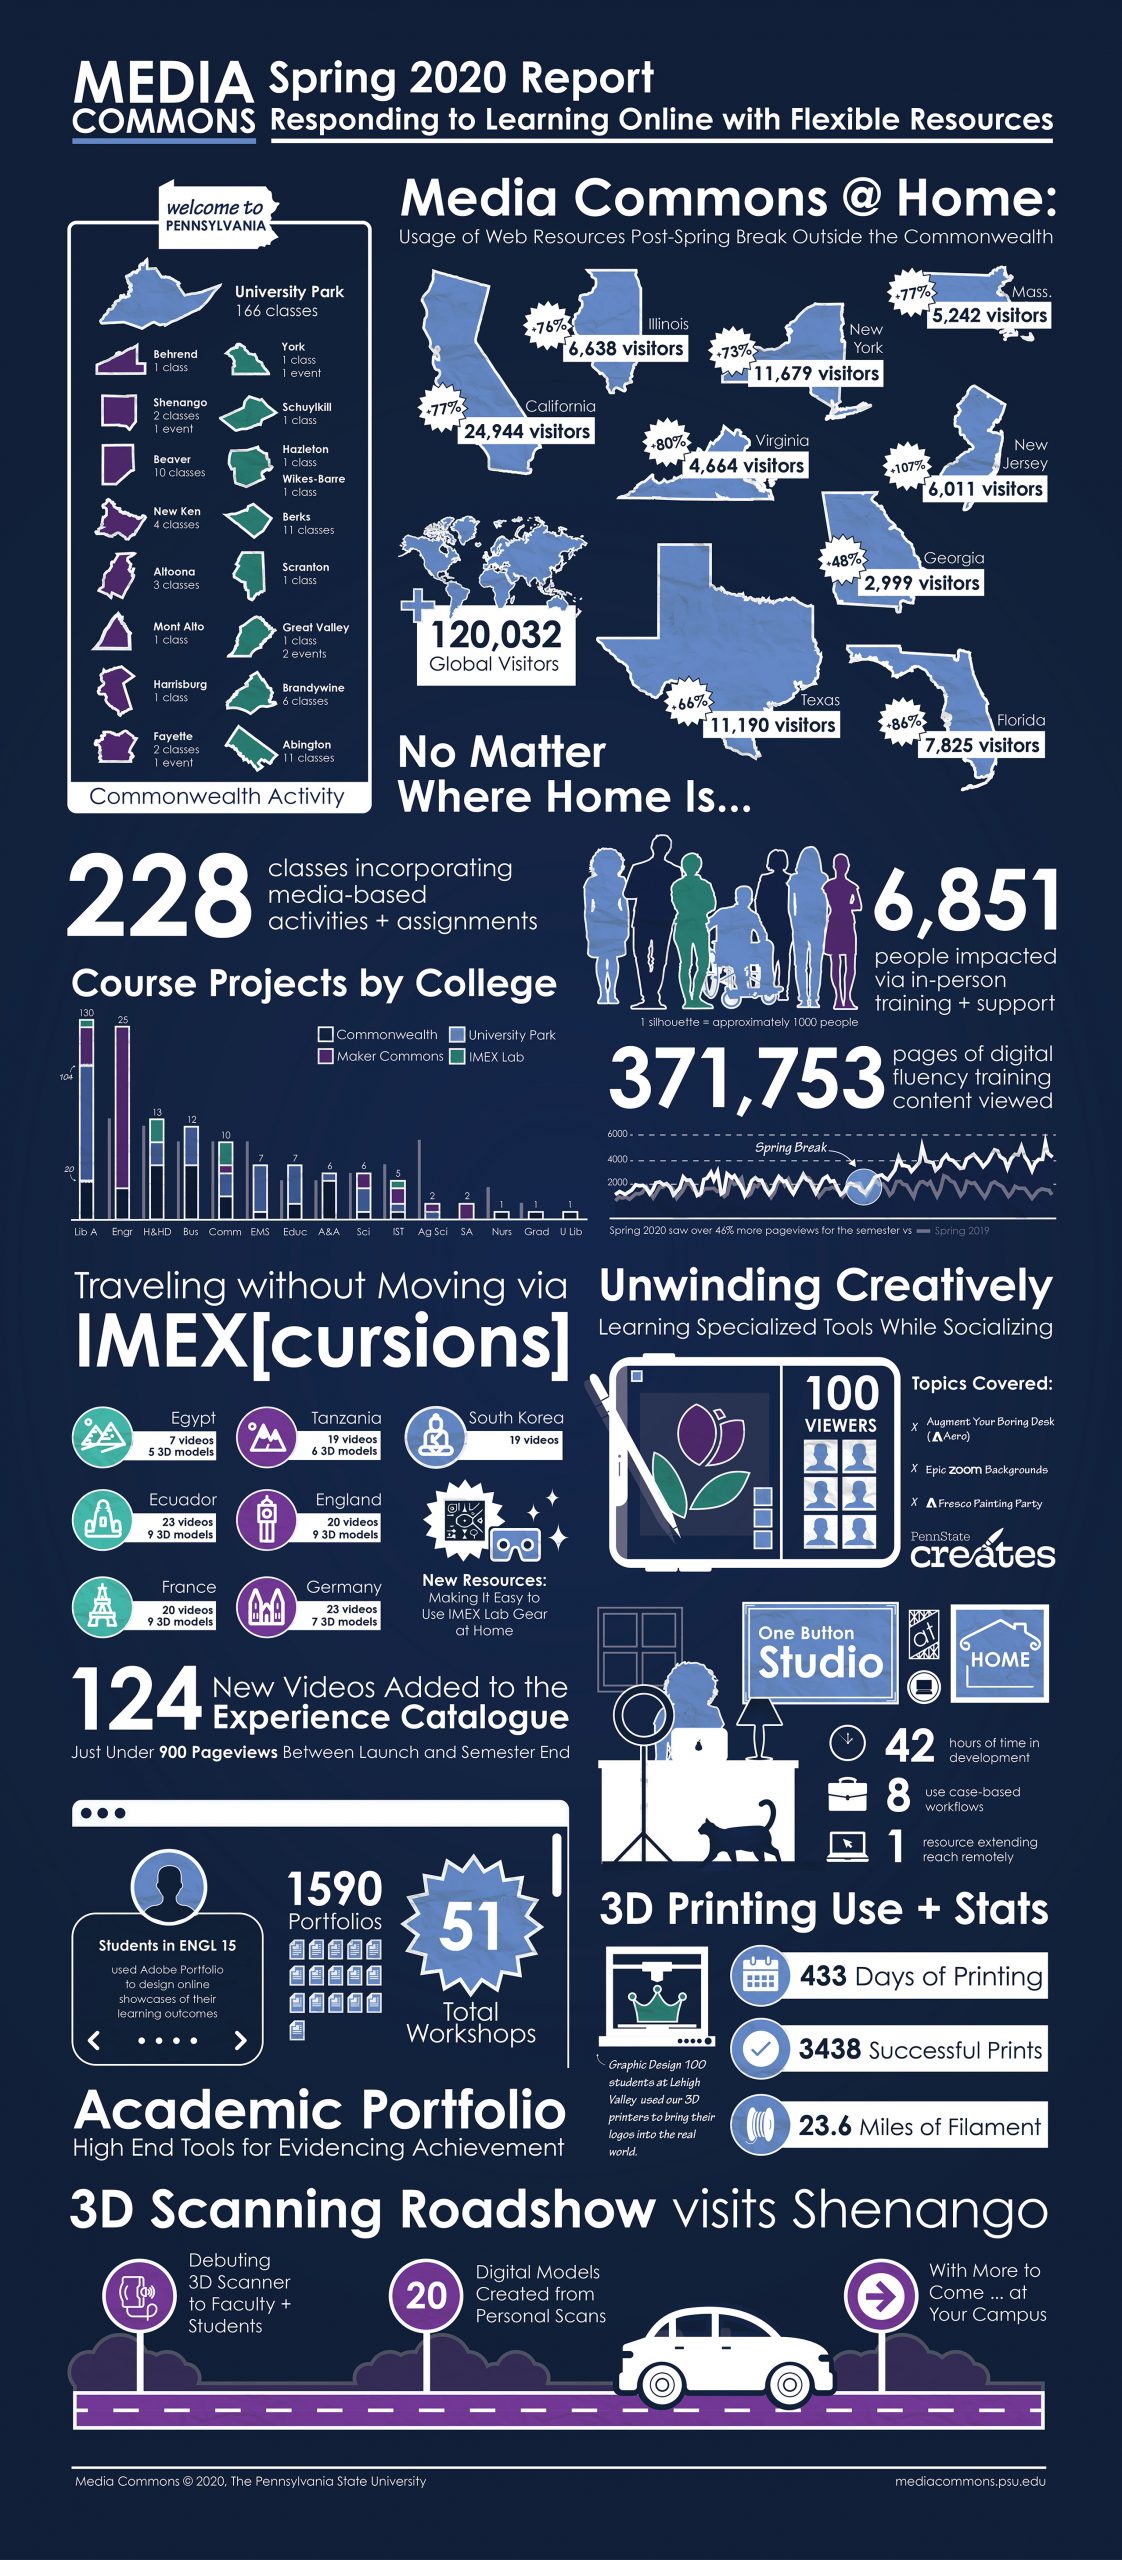 Spring 2020 Infographic
-
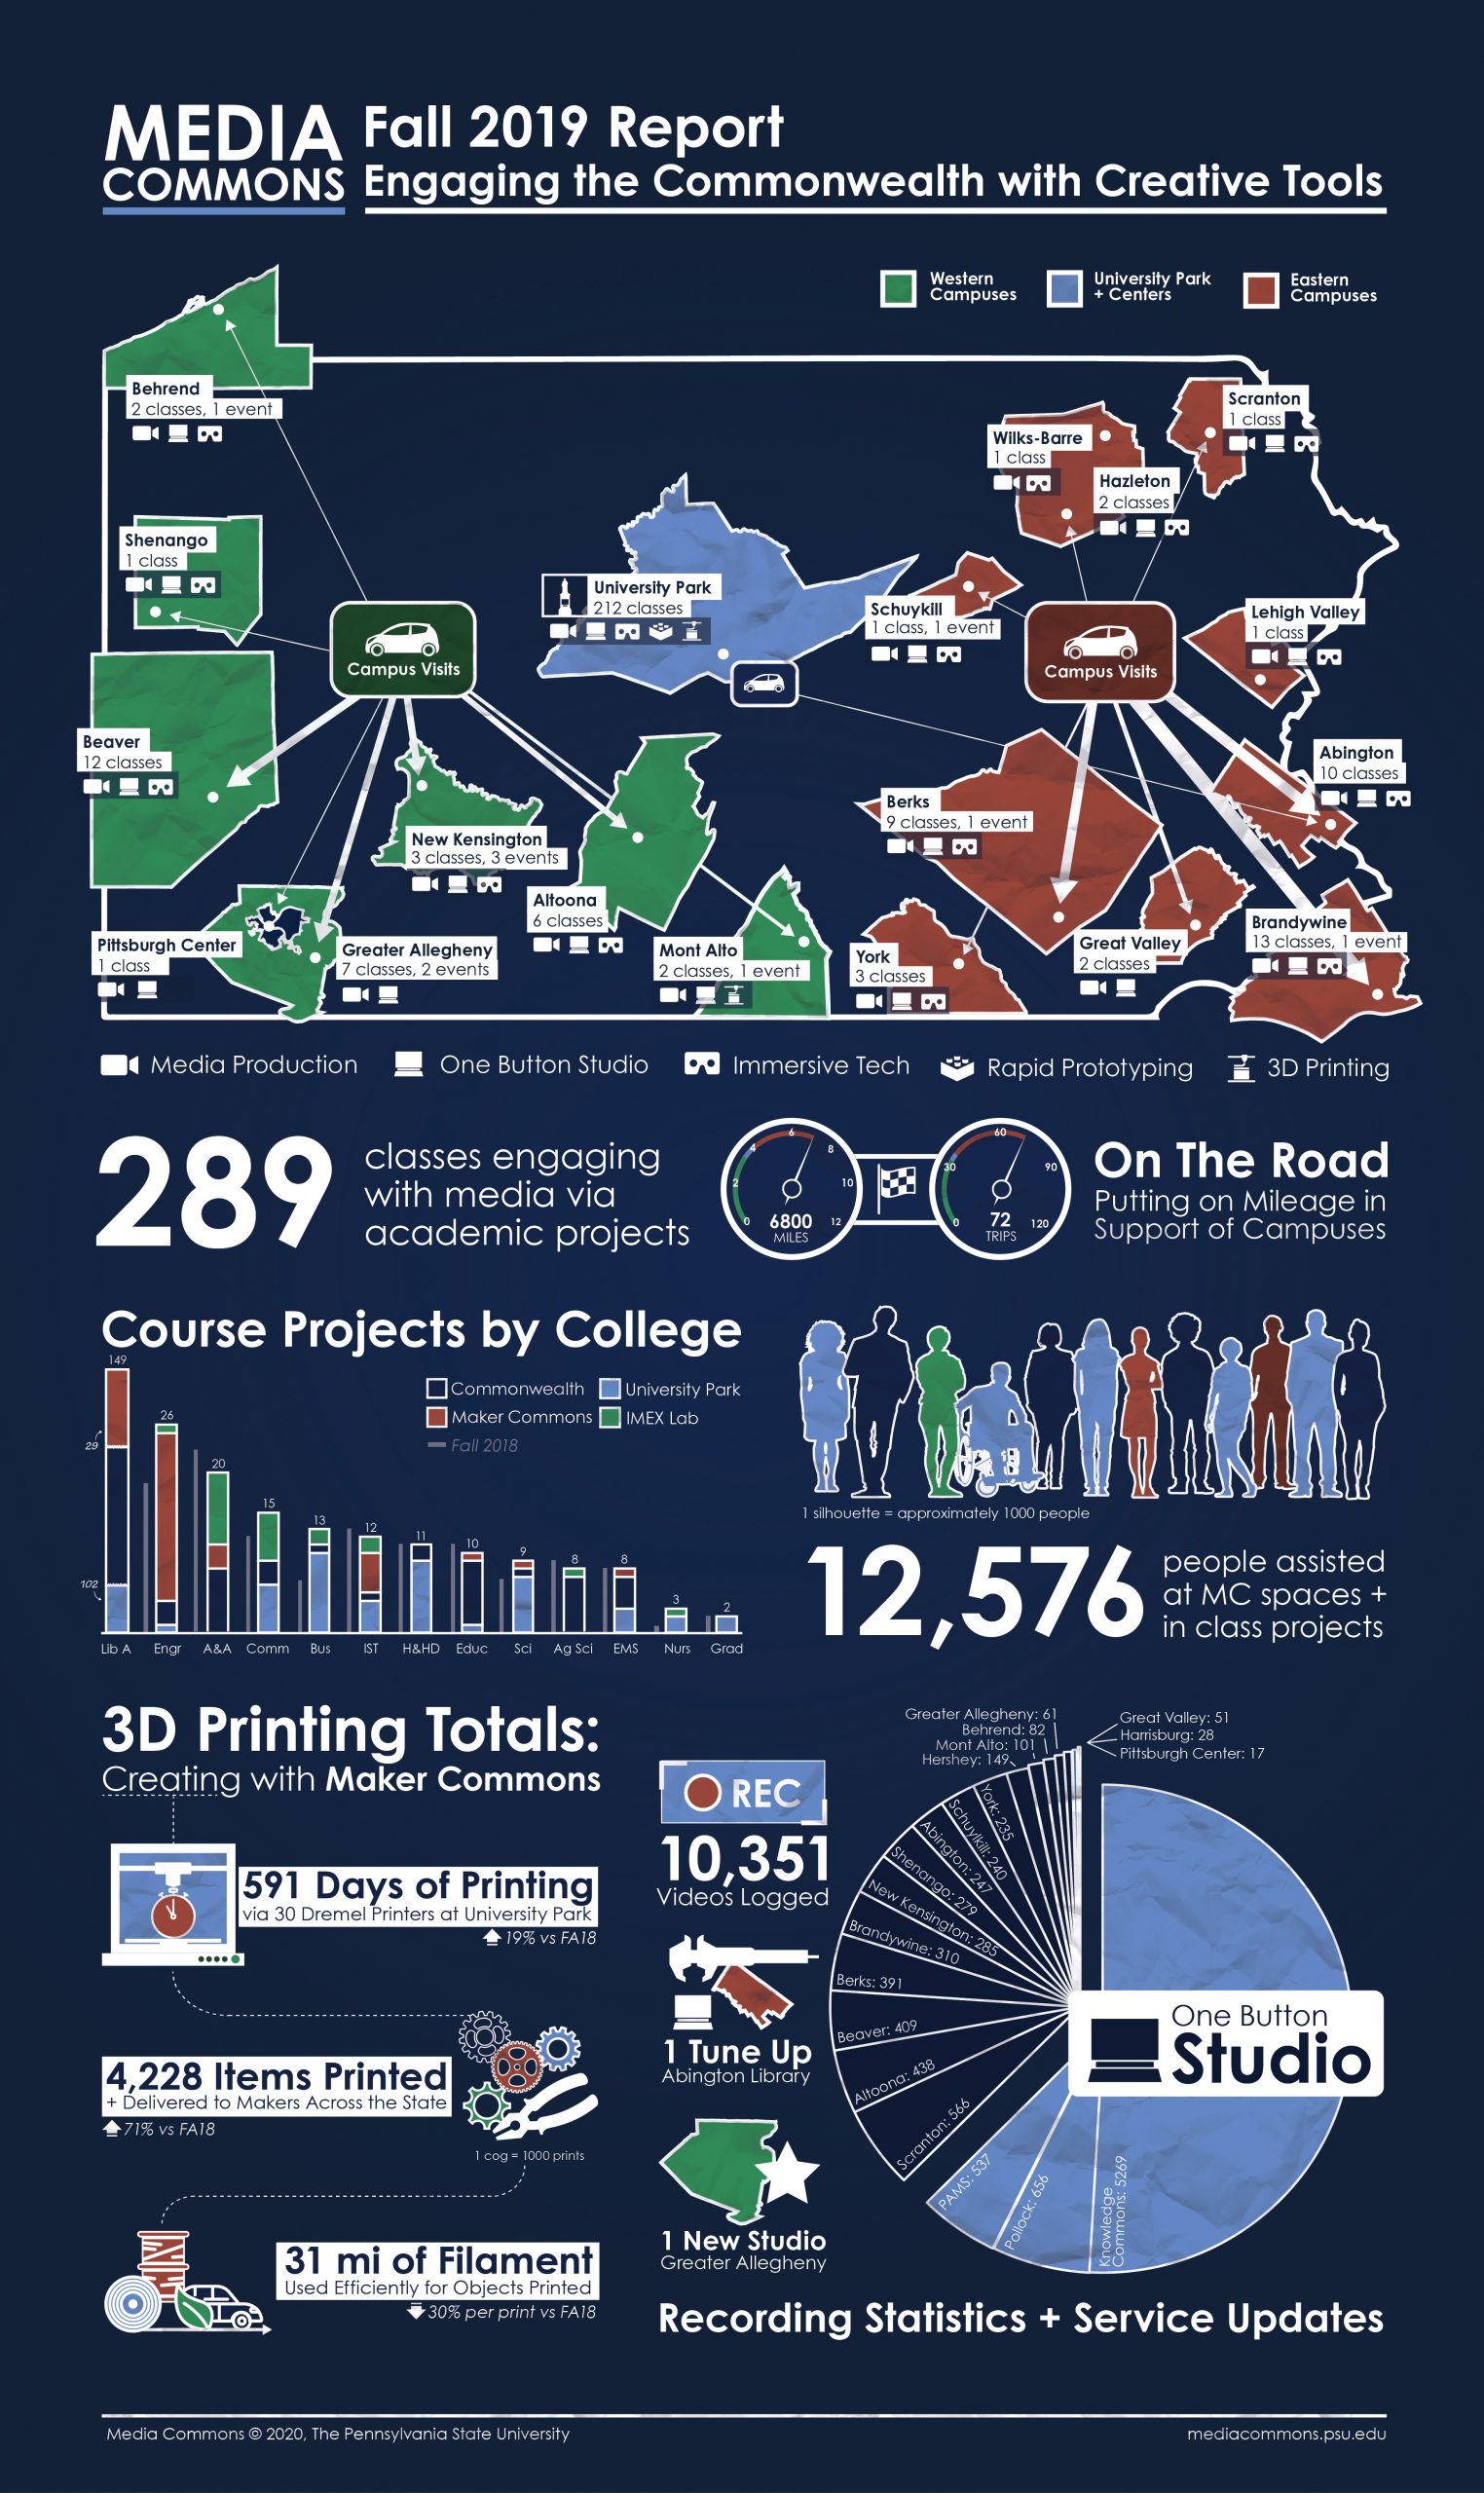 Fall 2019 Infographic
-
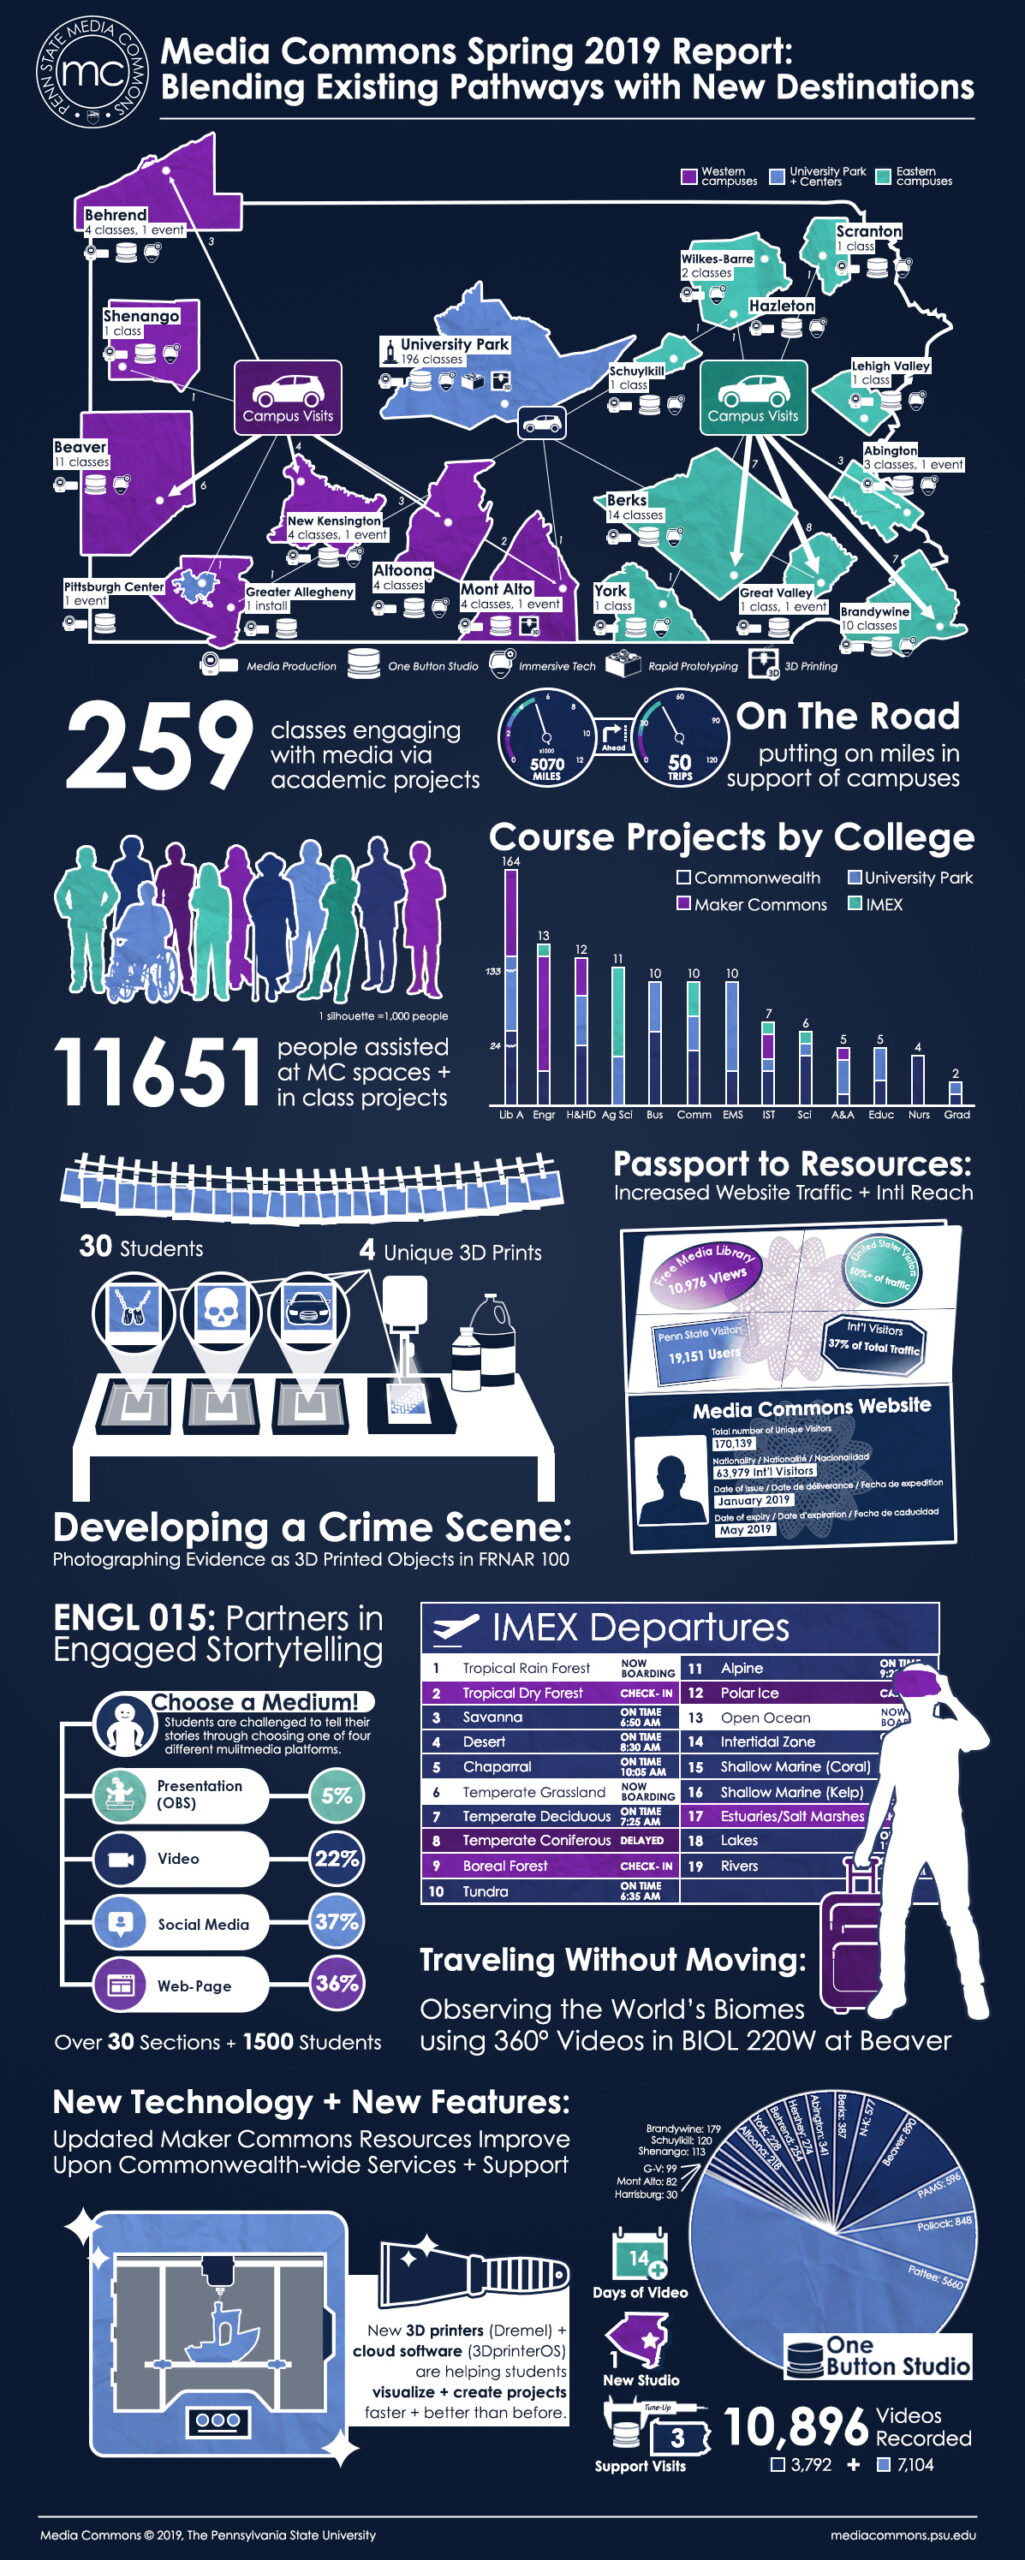 Spring 2019 Infographic
-
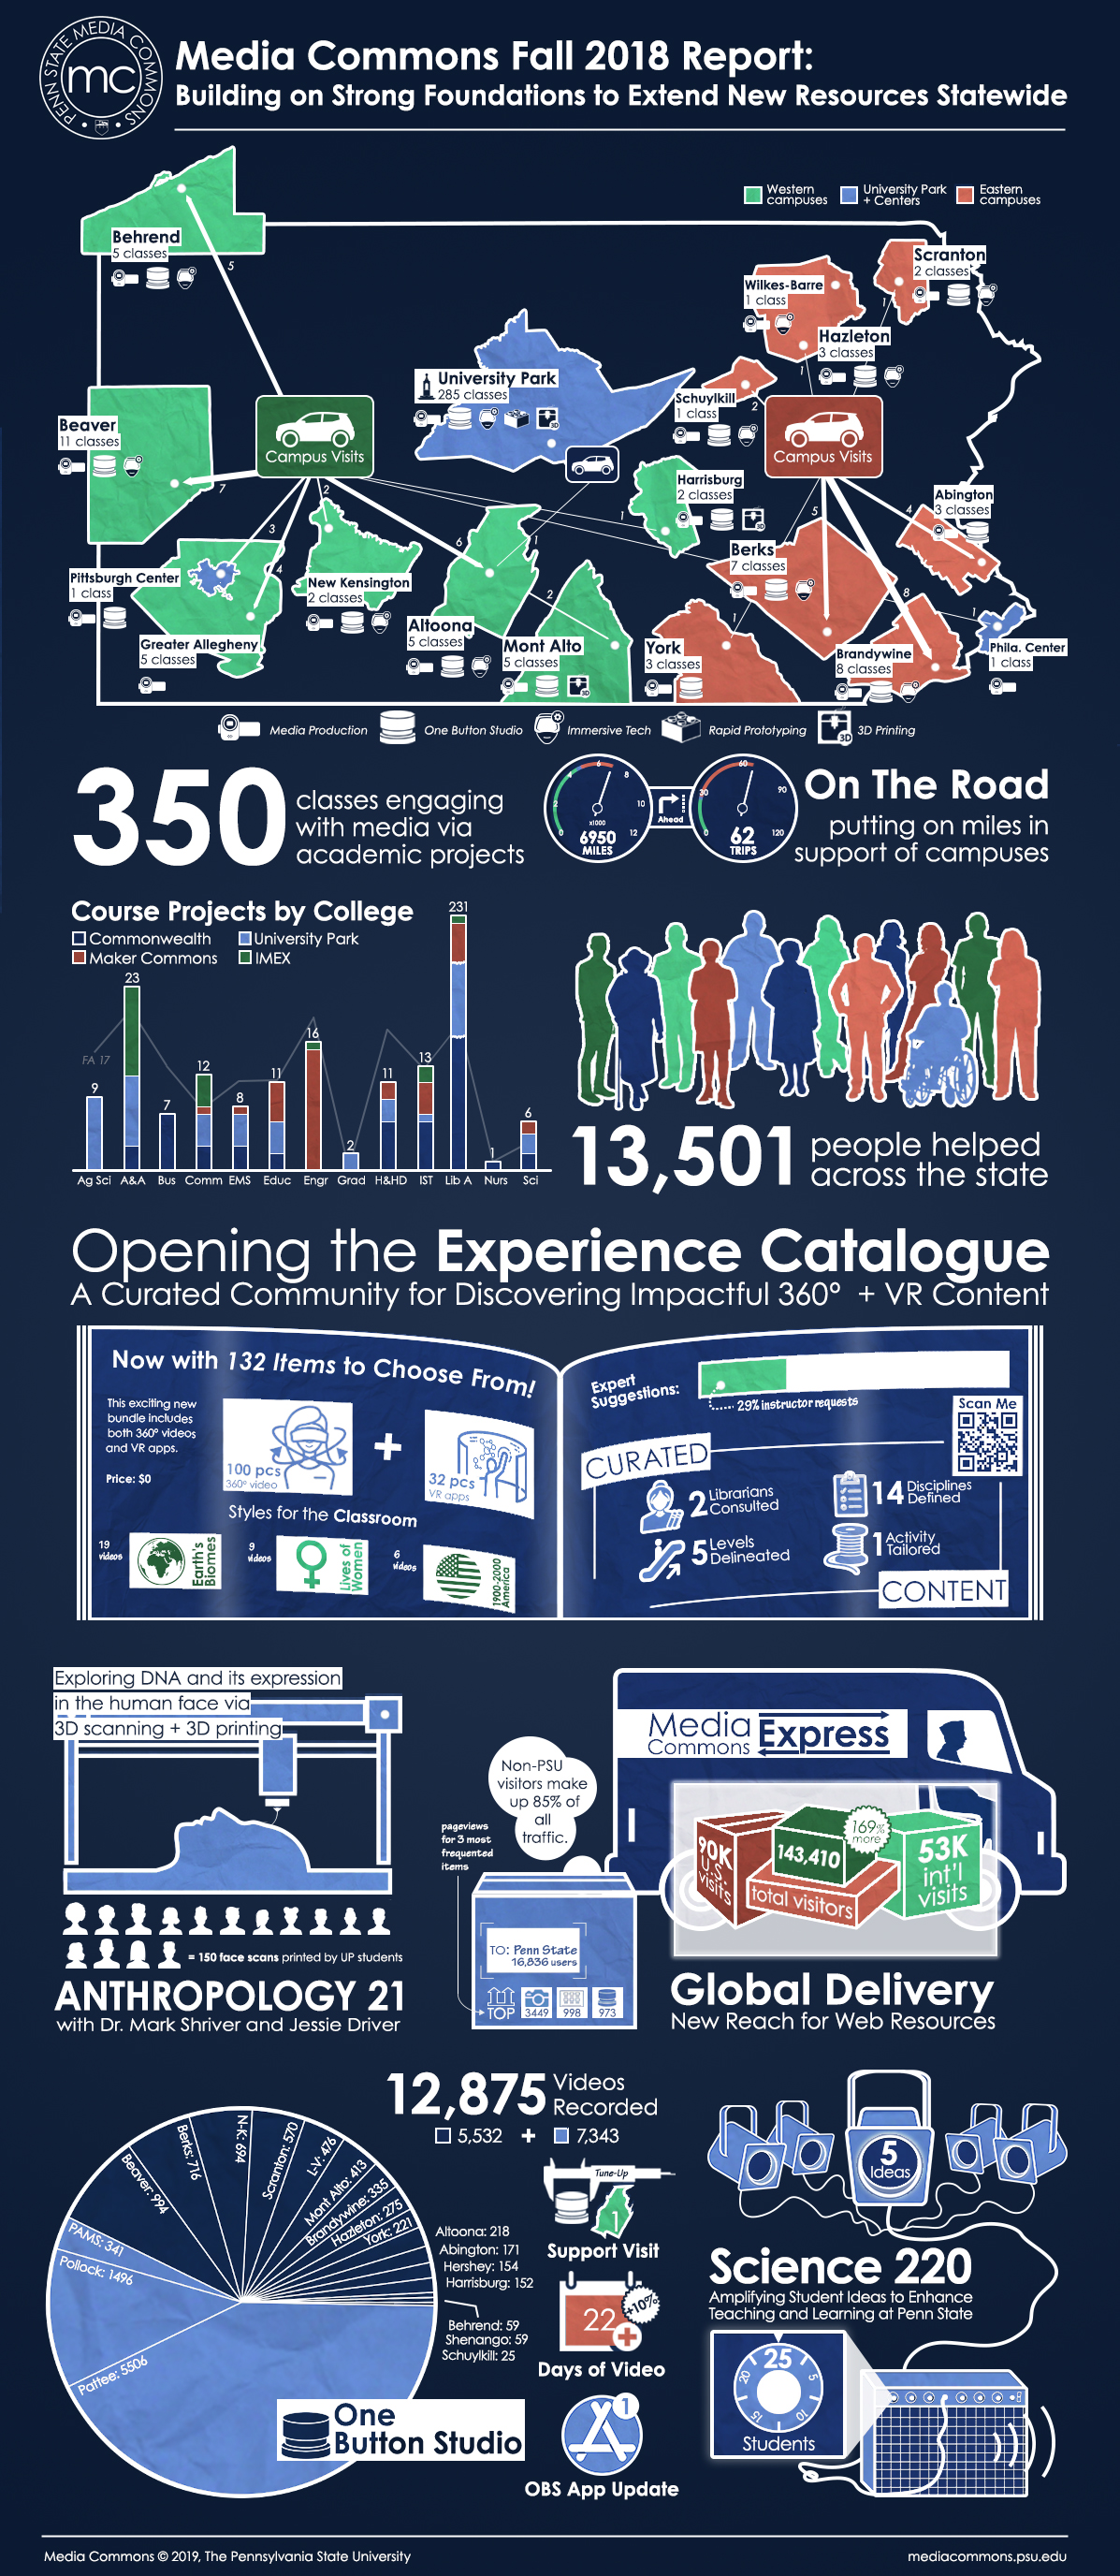 Fall 2018 Infographic
-
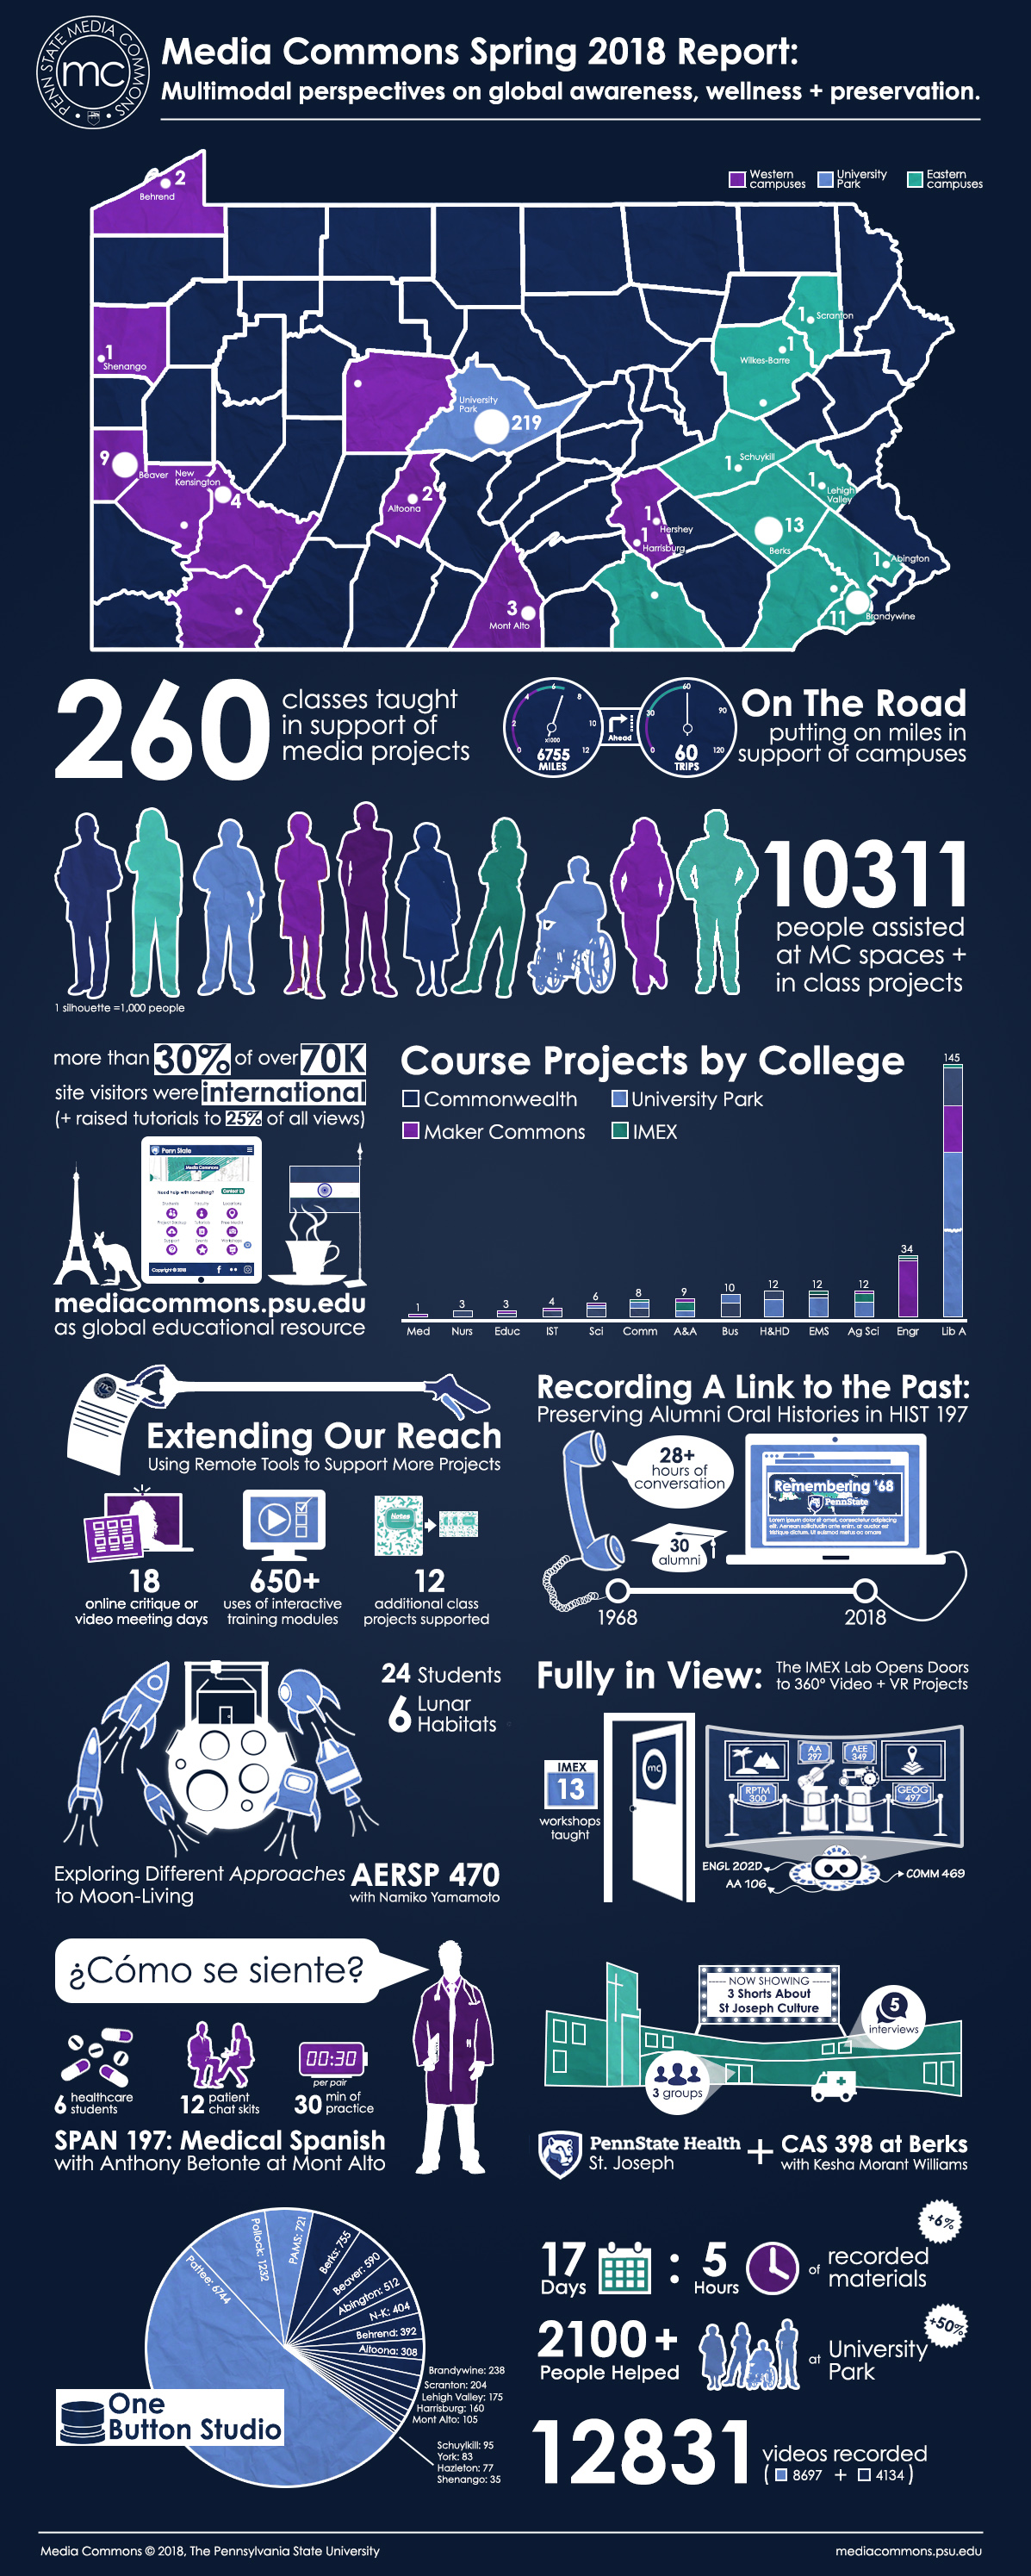 Spring 2018 Infographic
-
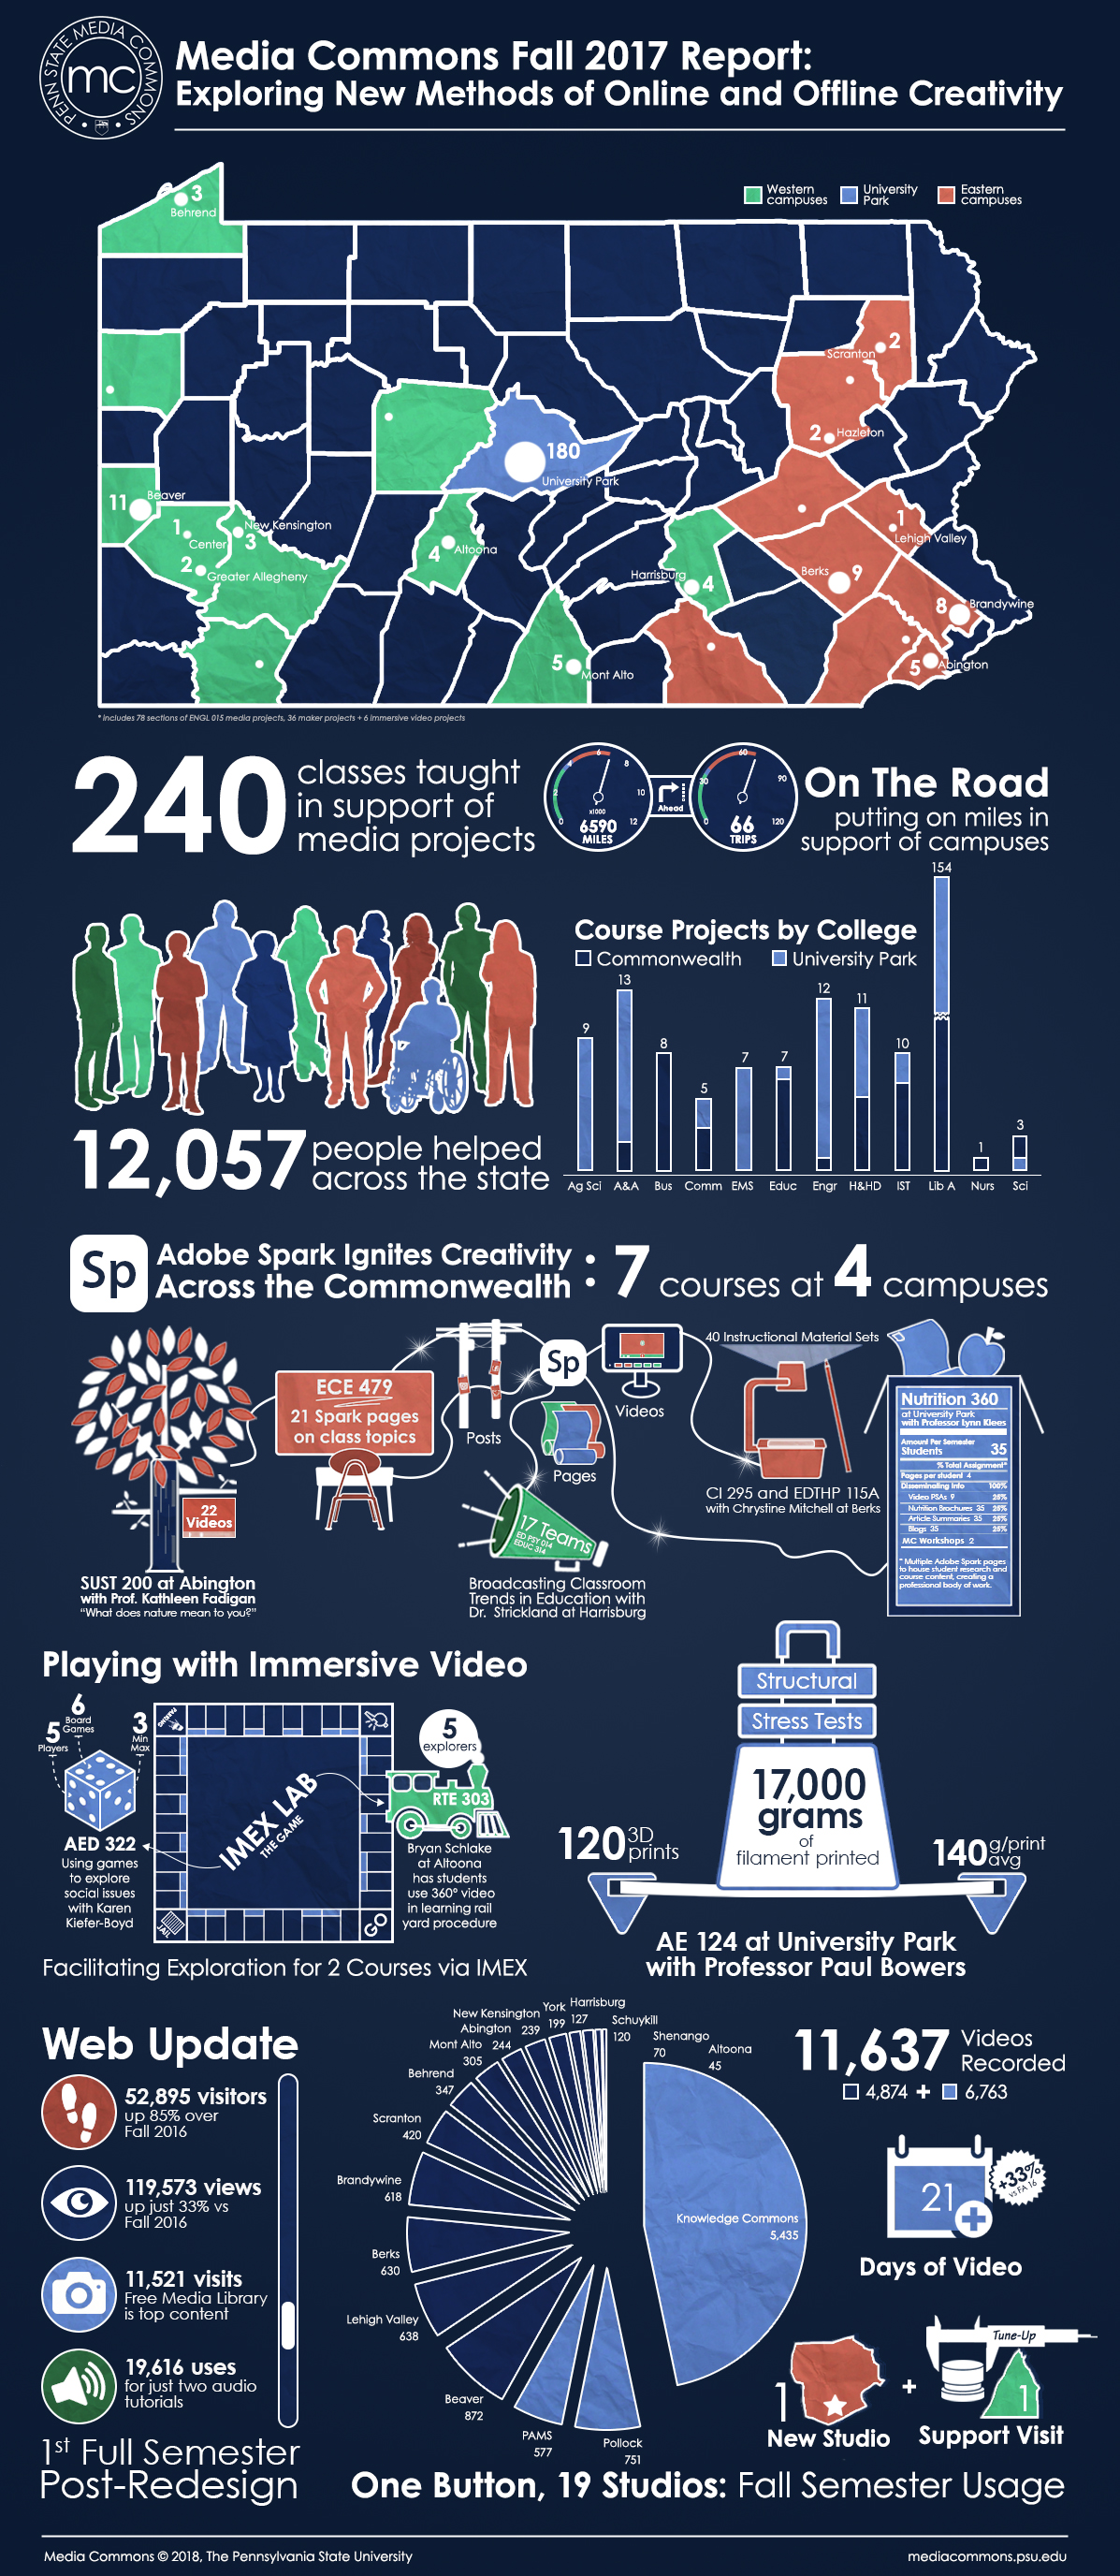 Fall 2017 Infographic
-
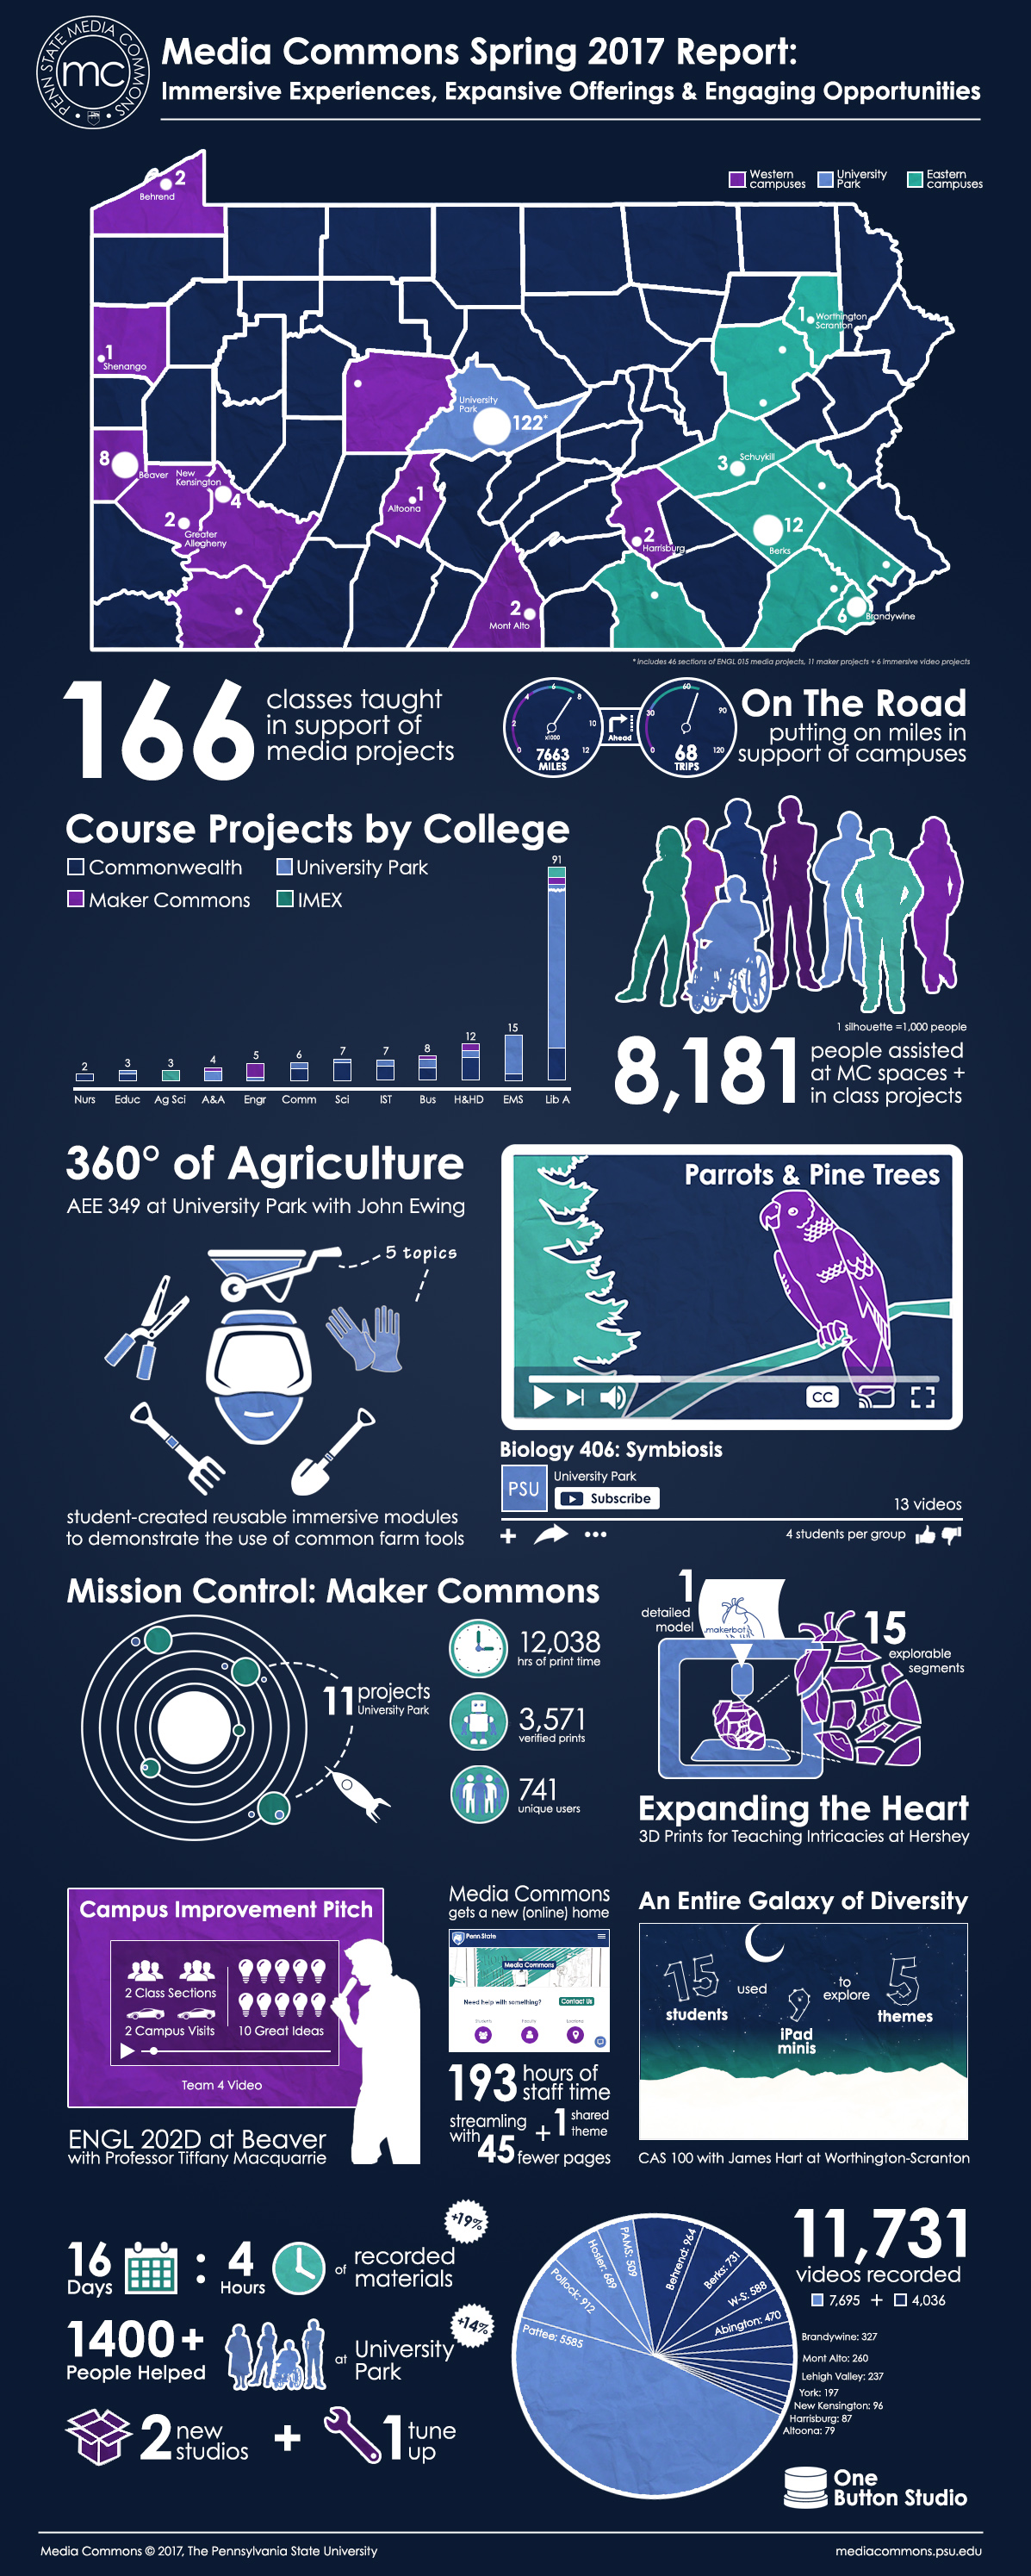 Spring 2017 Infographic
-
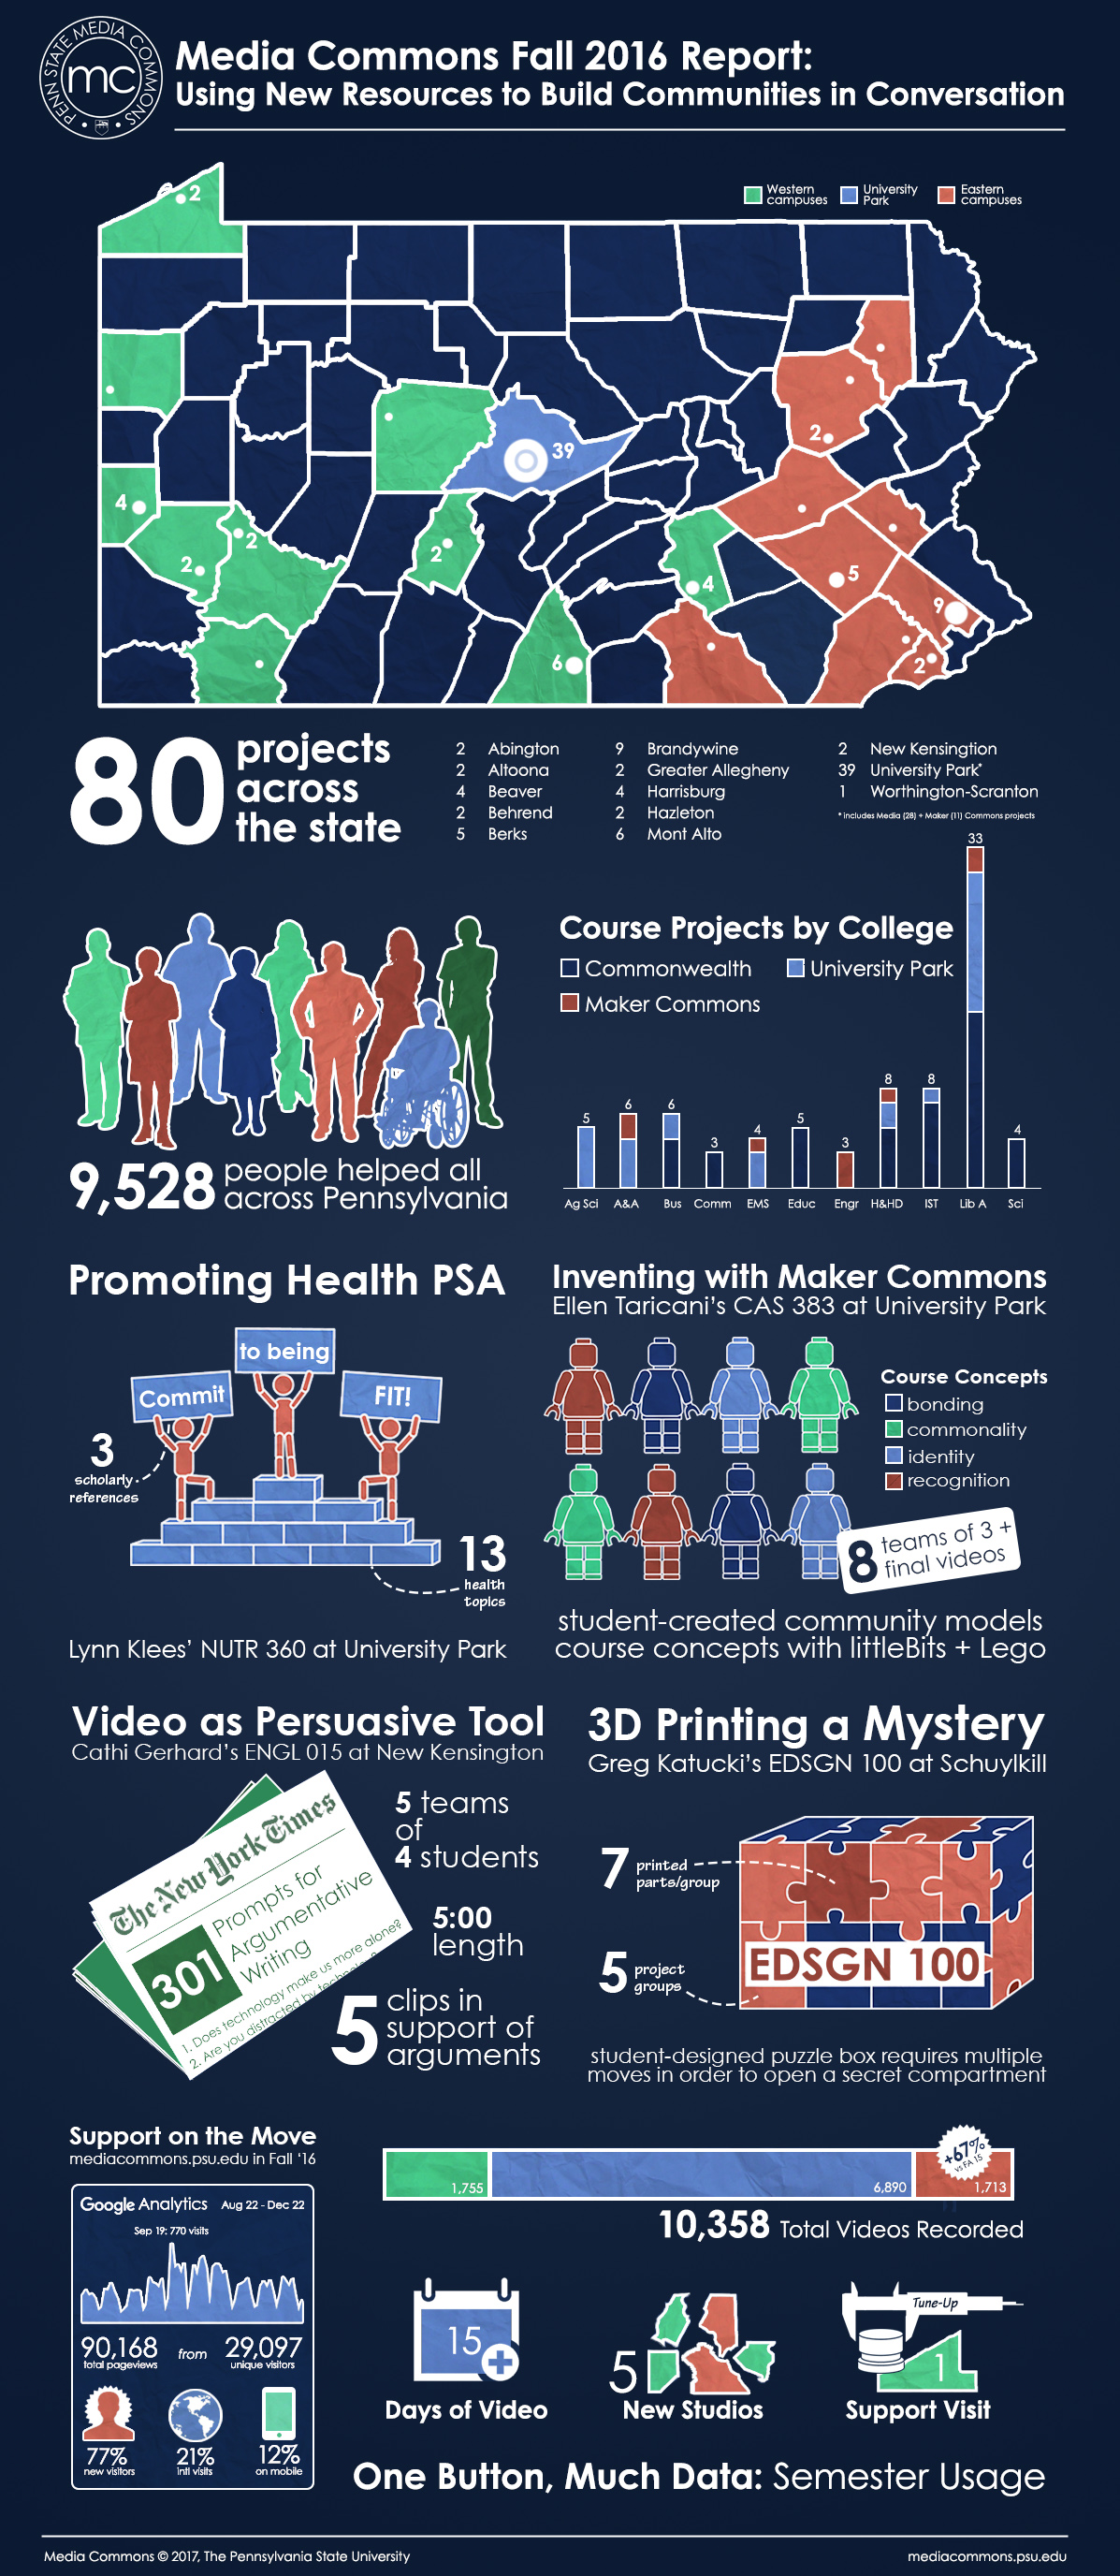 Fall 2016 Infographic
-
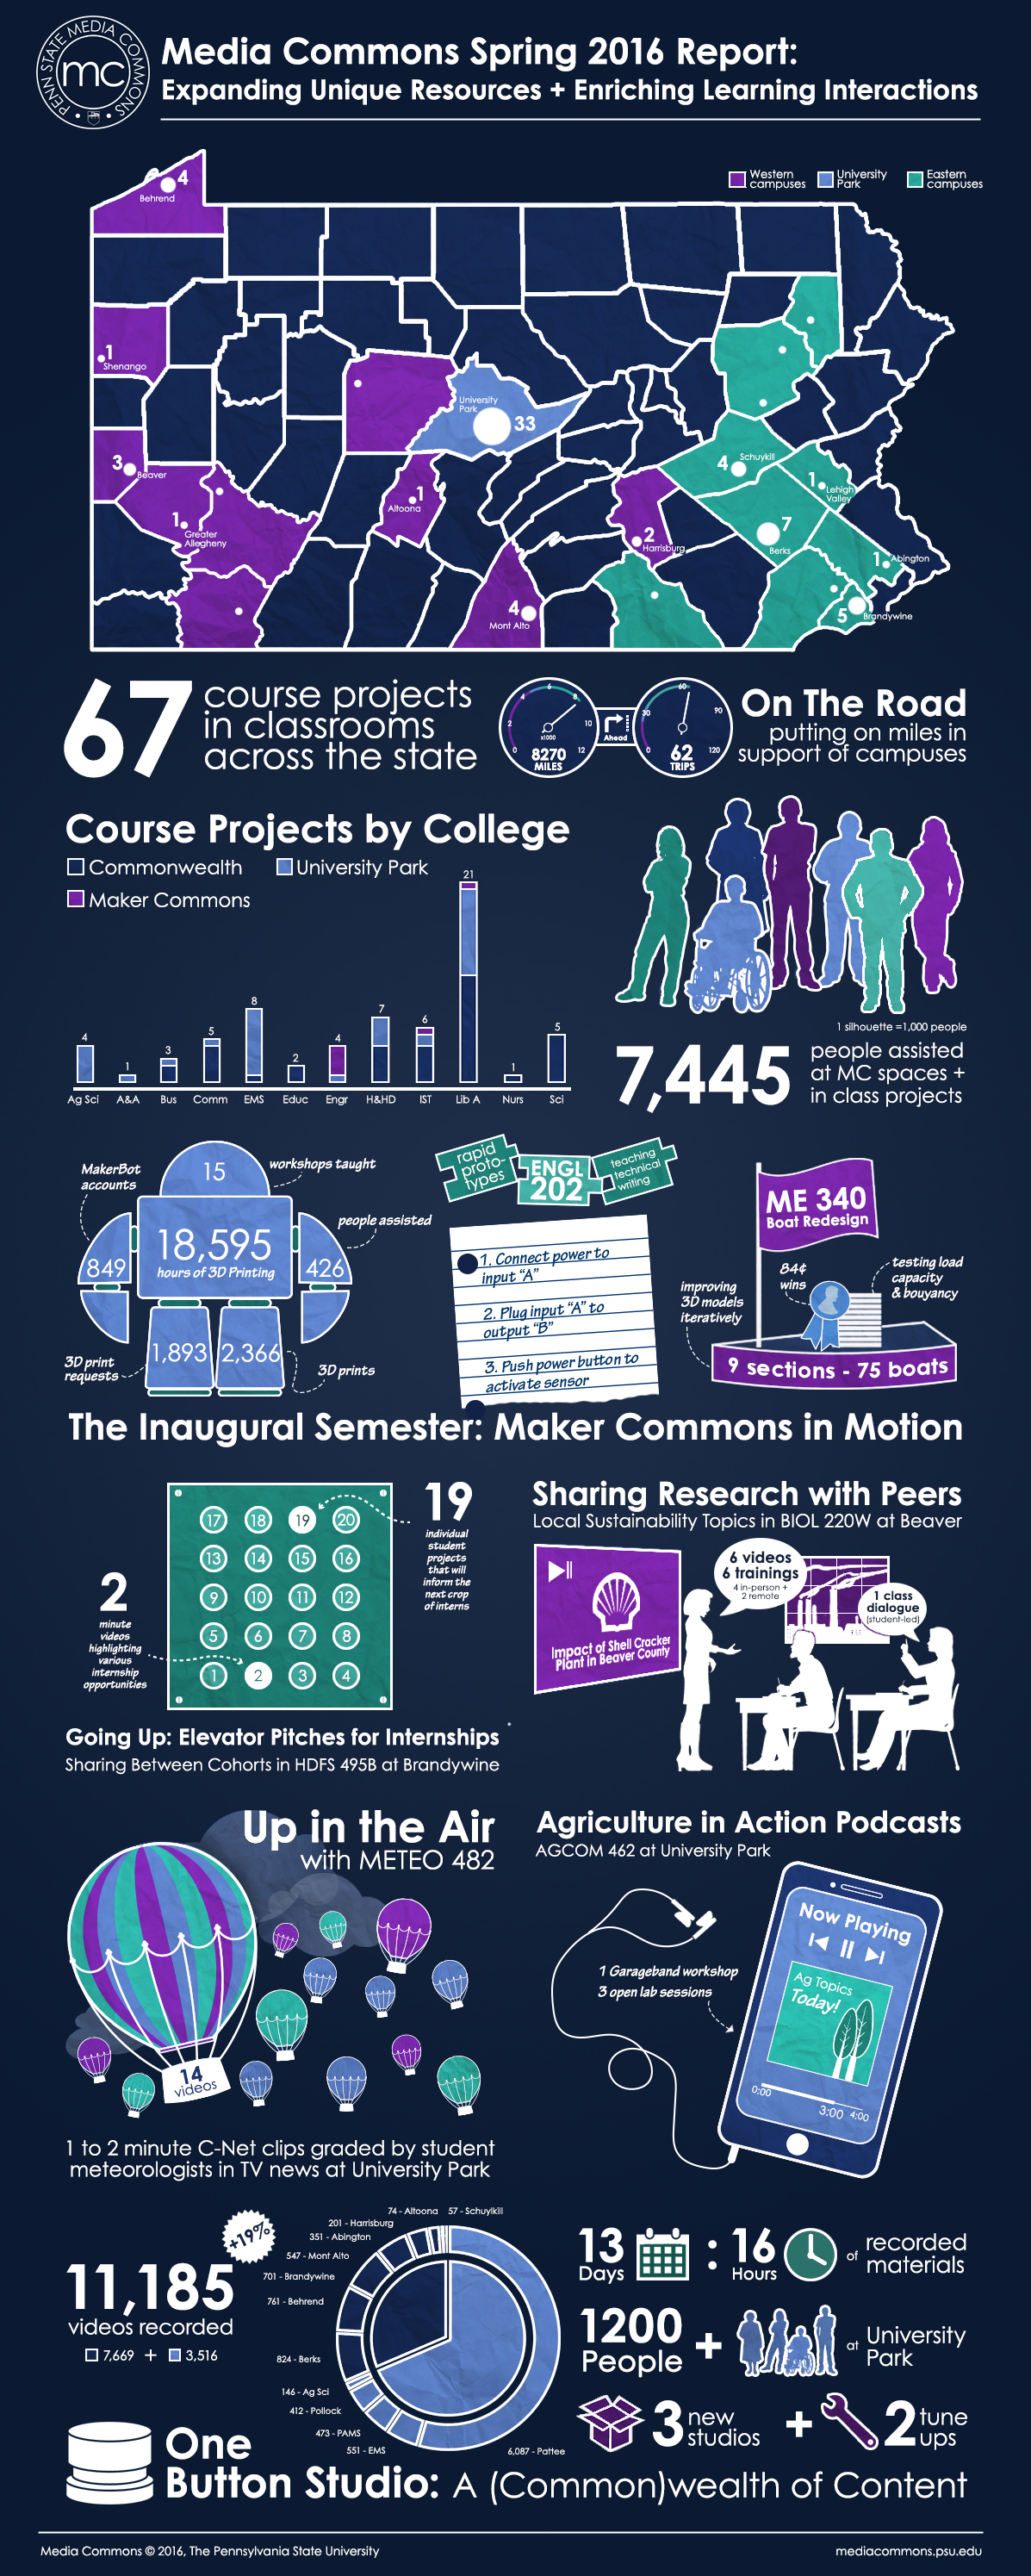 Spring 2016 Infographic
-
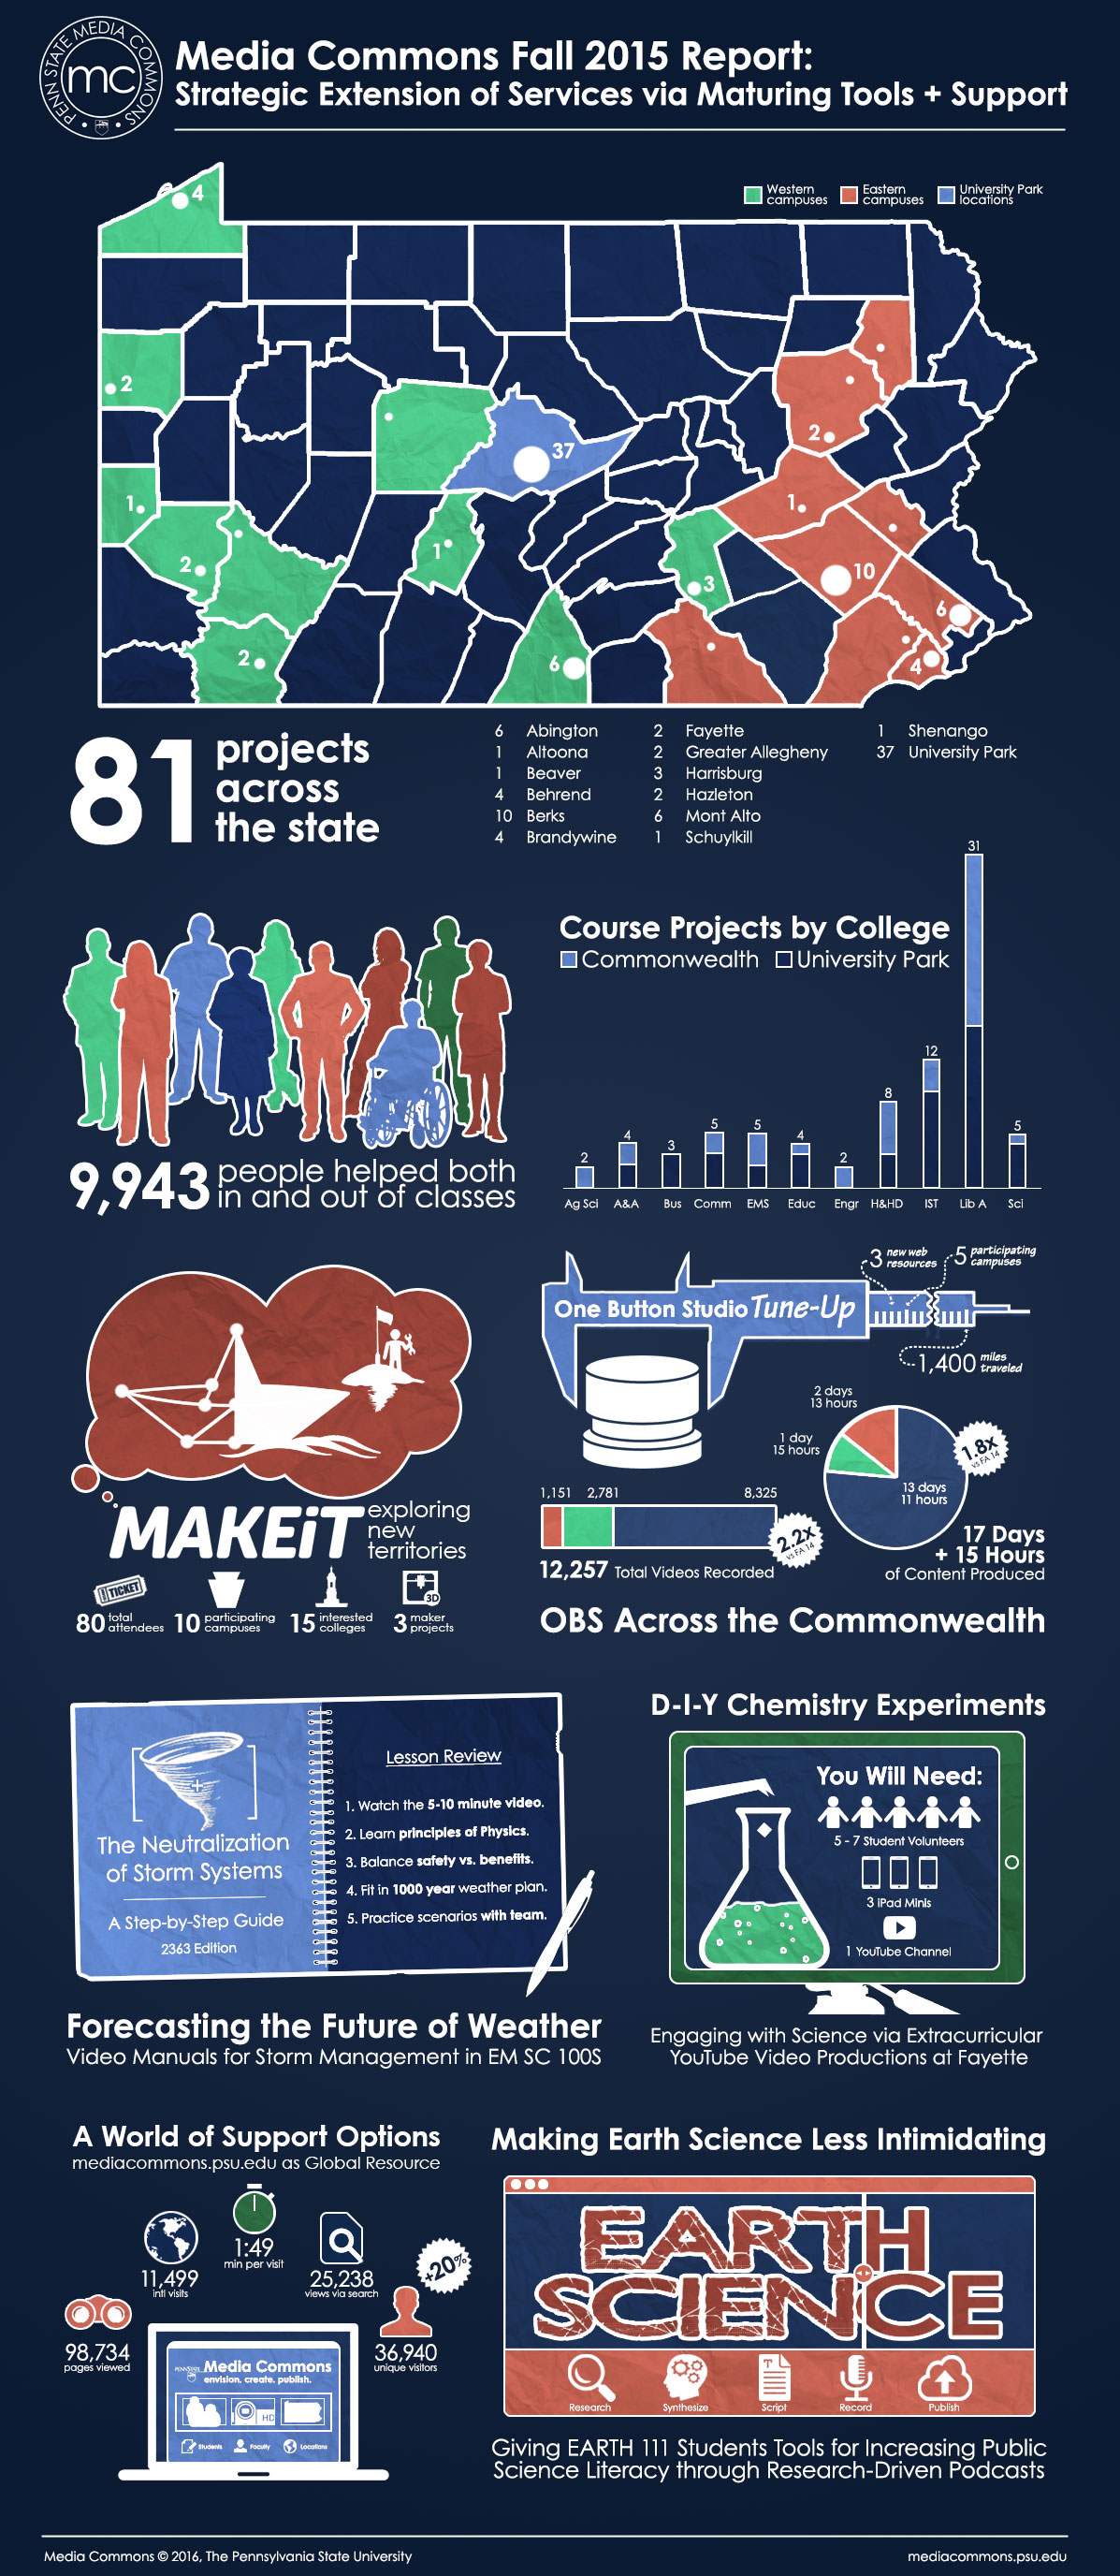 Fall 2015 Infographic
-
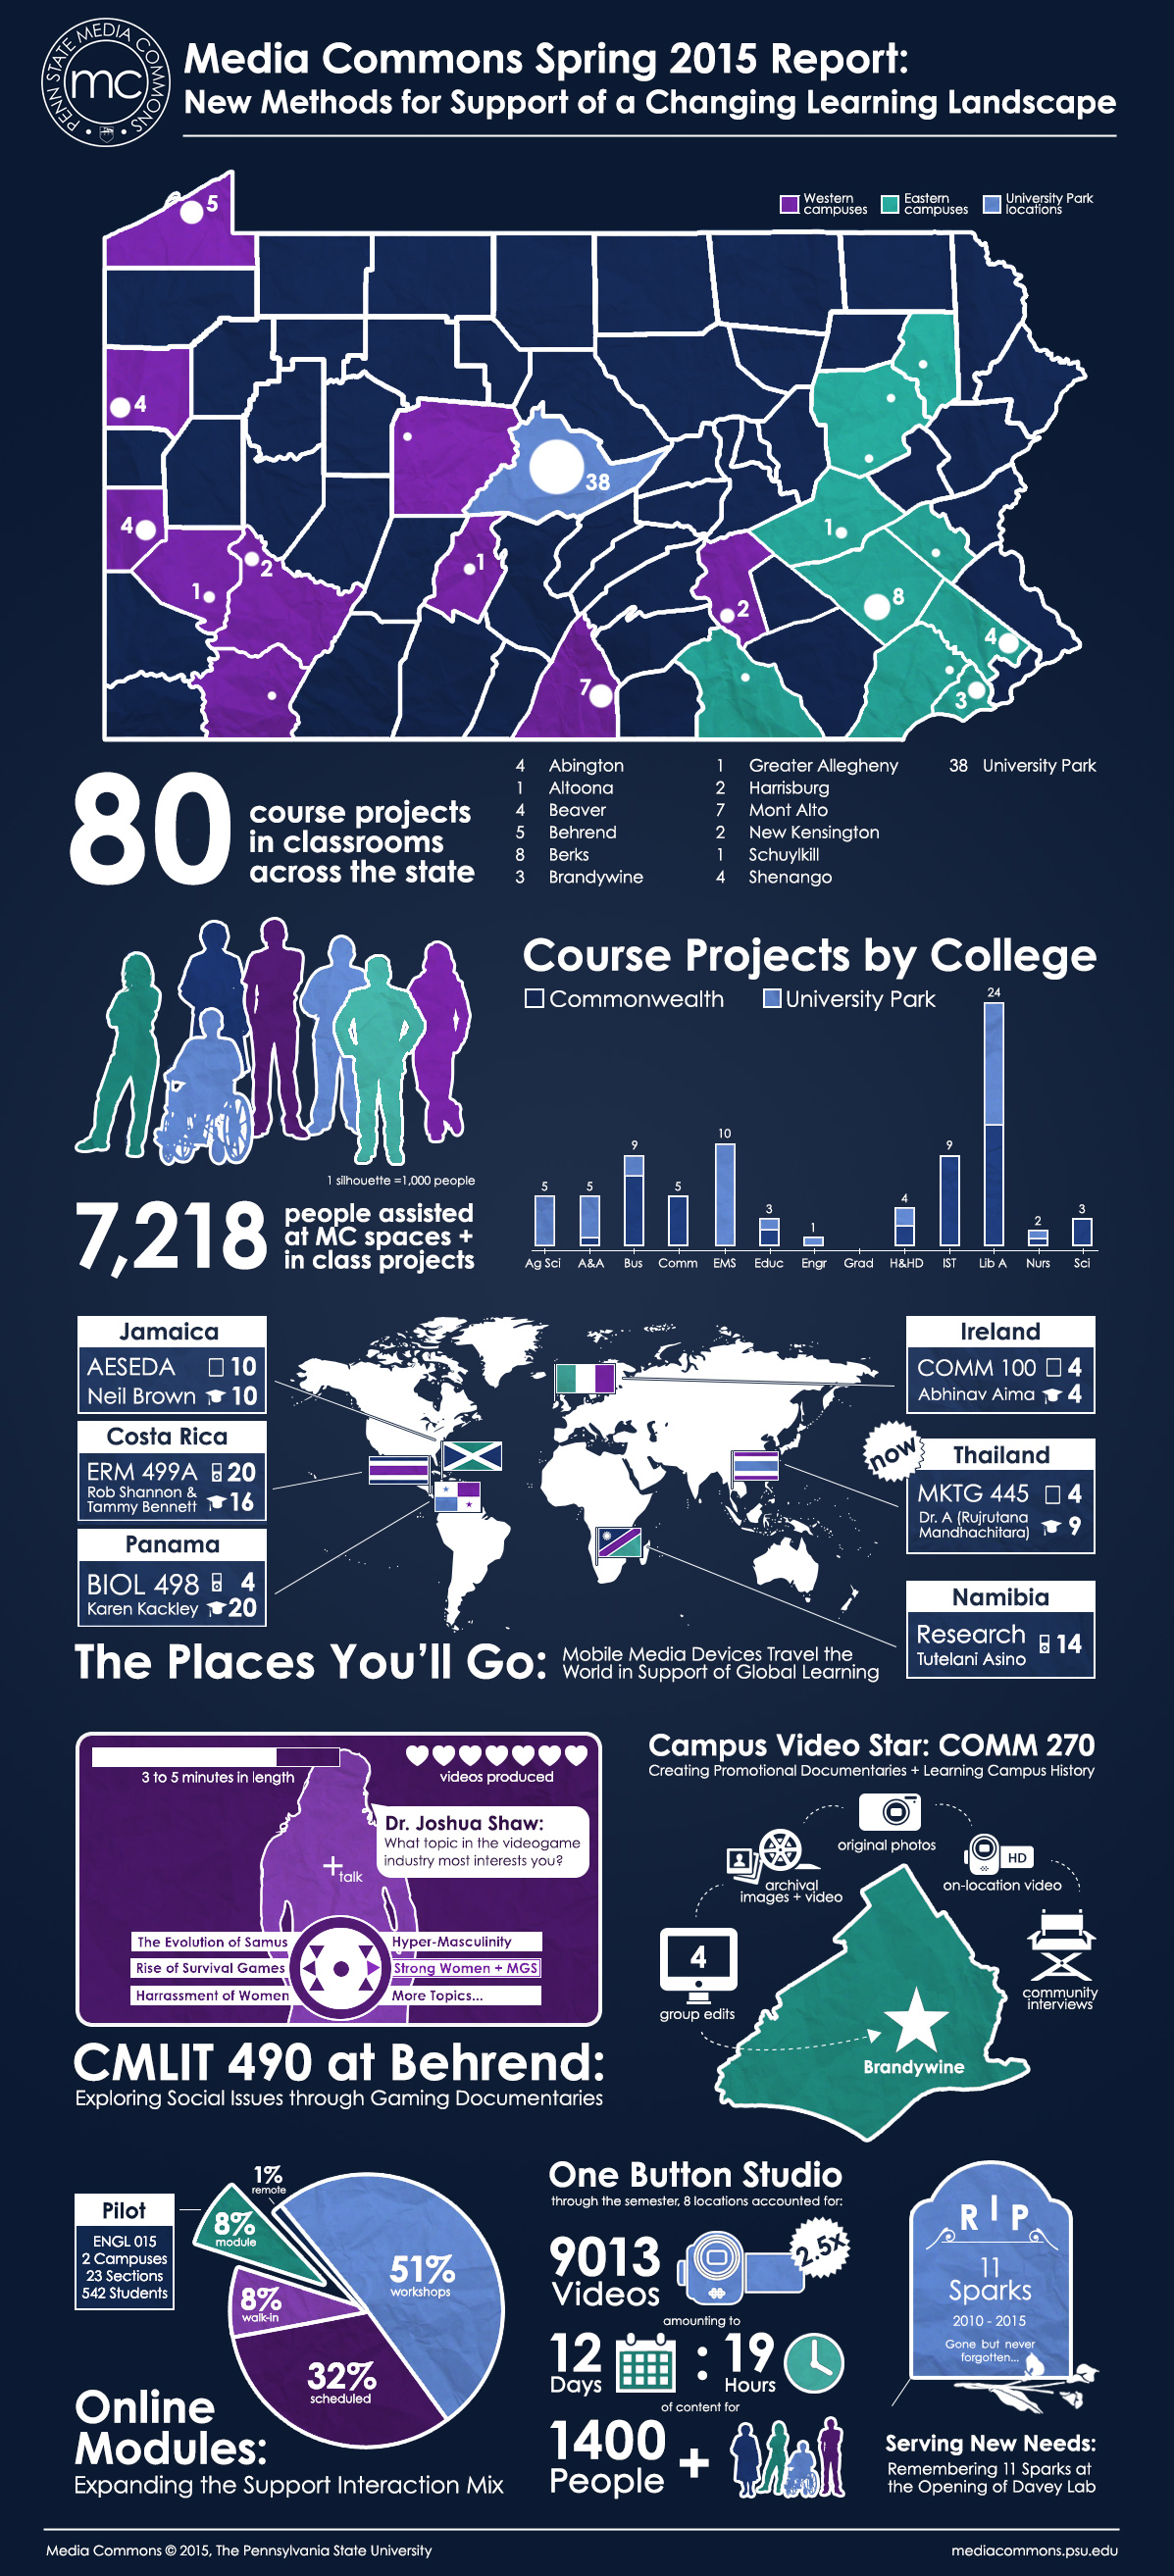 Spring 2015 Infographic
-
 Fall 2014 Infographic
-
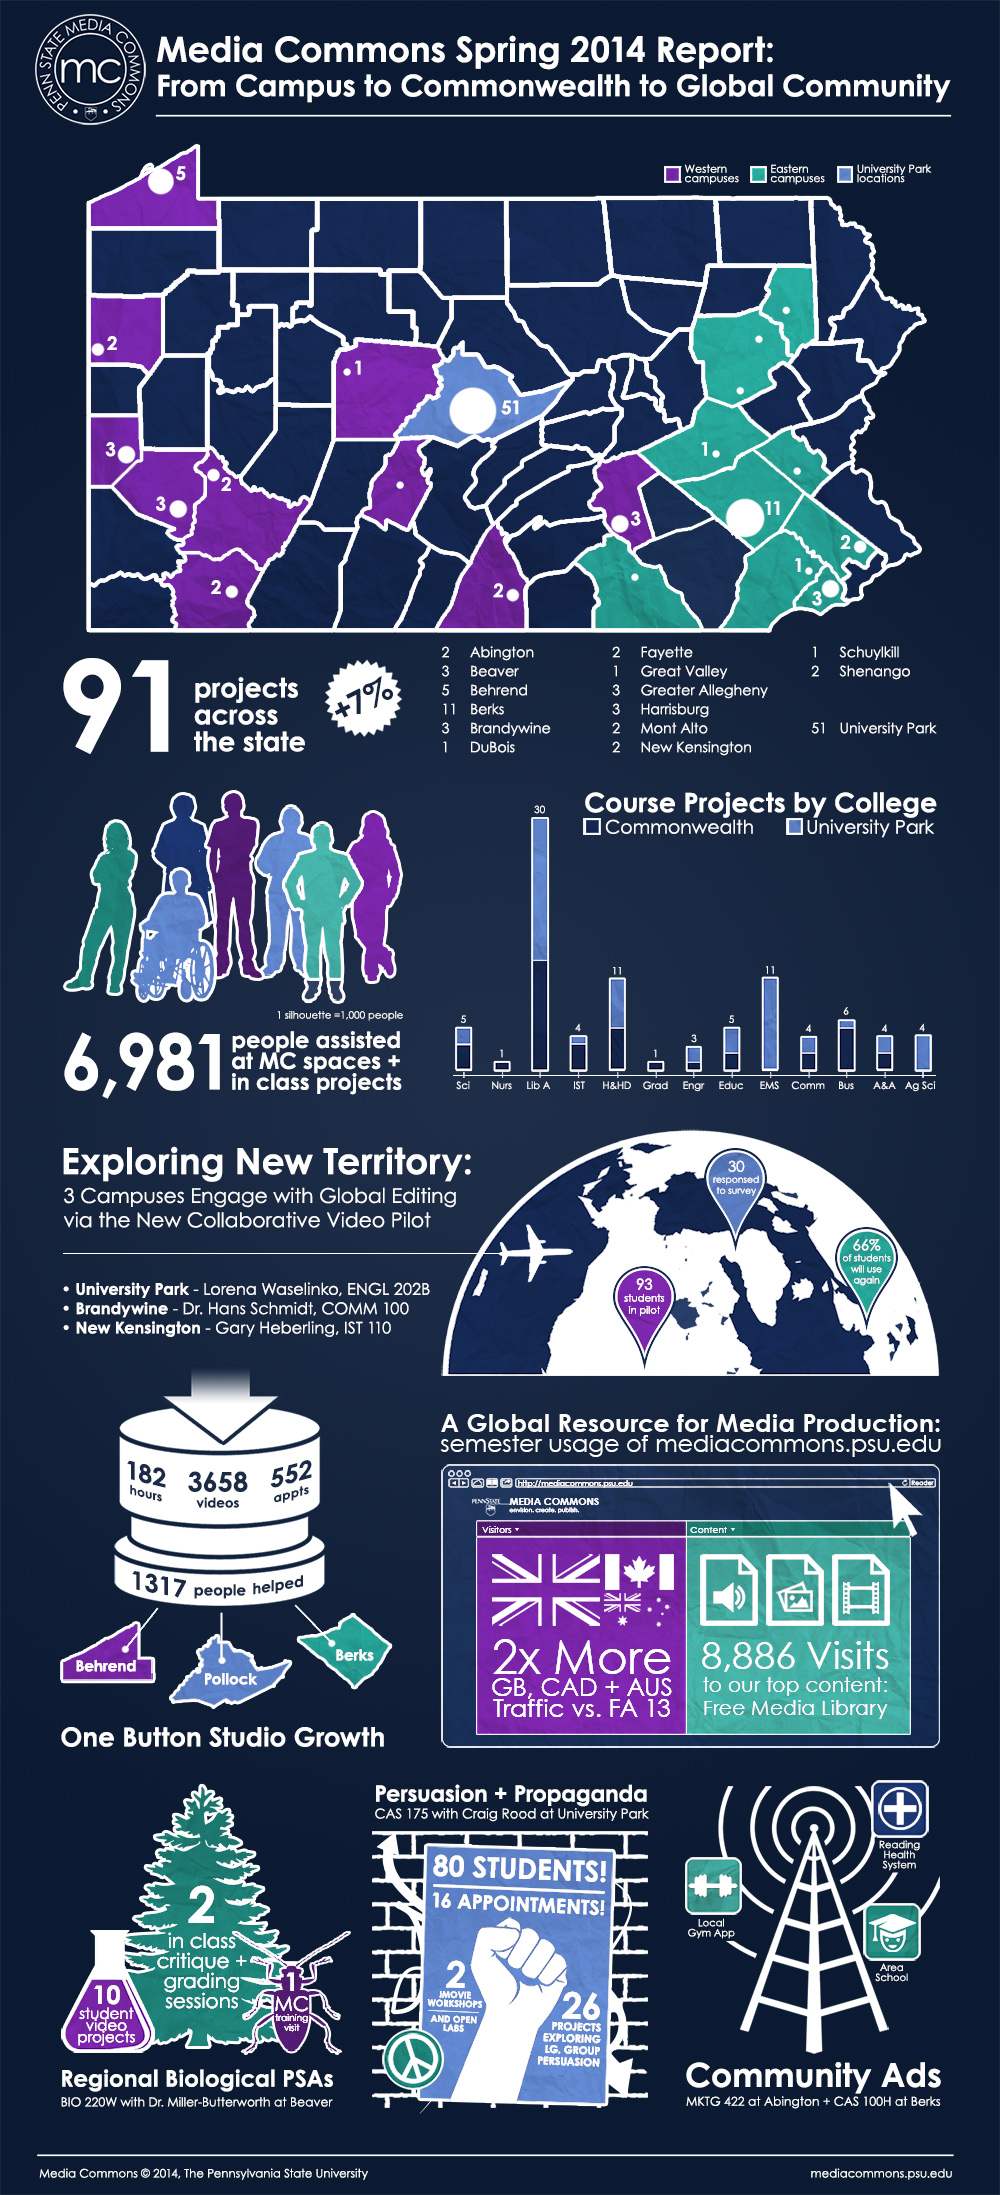 Spring 2014 Infographic (introduced new color coding)
-
 Fall 2013 Infographic
-
 Spring 2013 Infographic
-
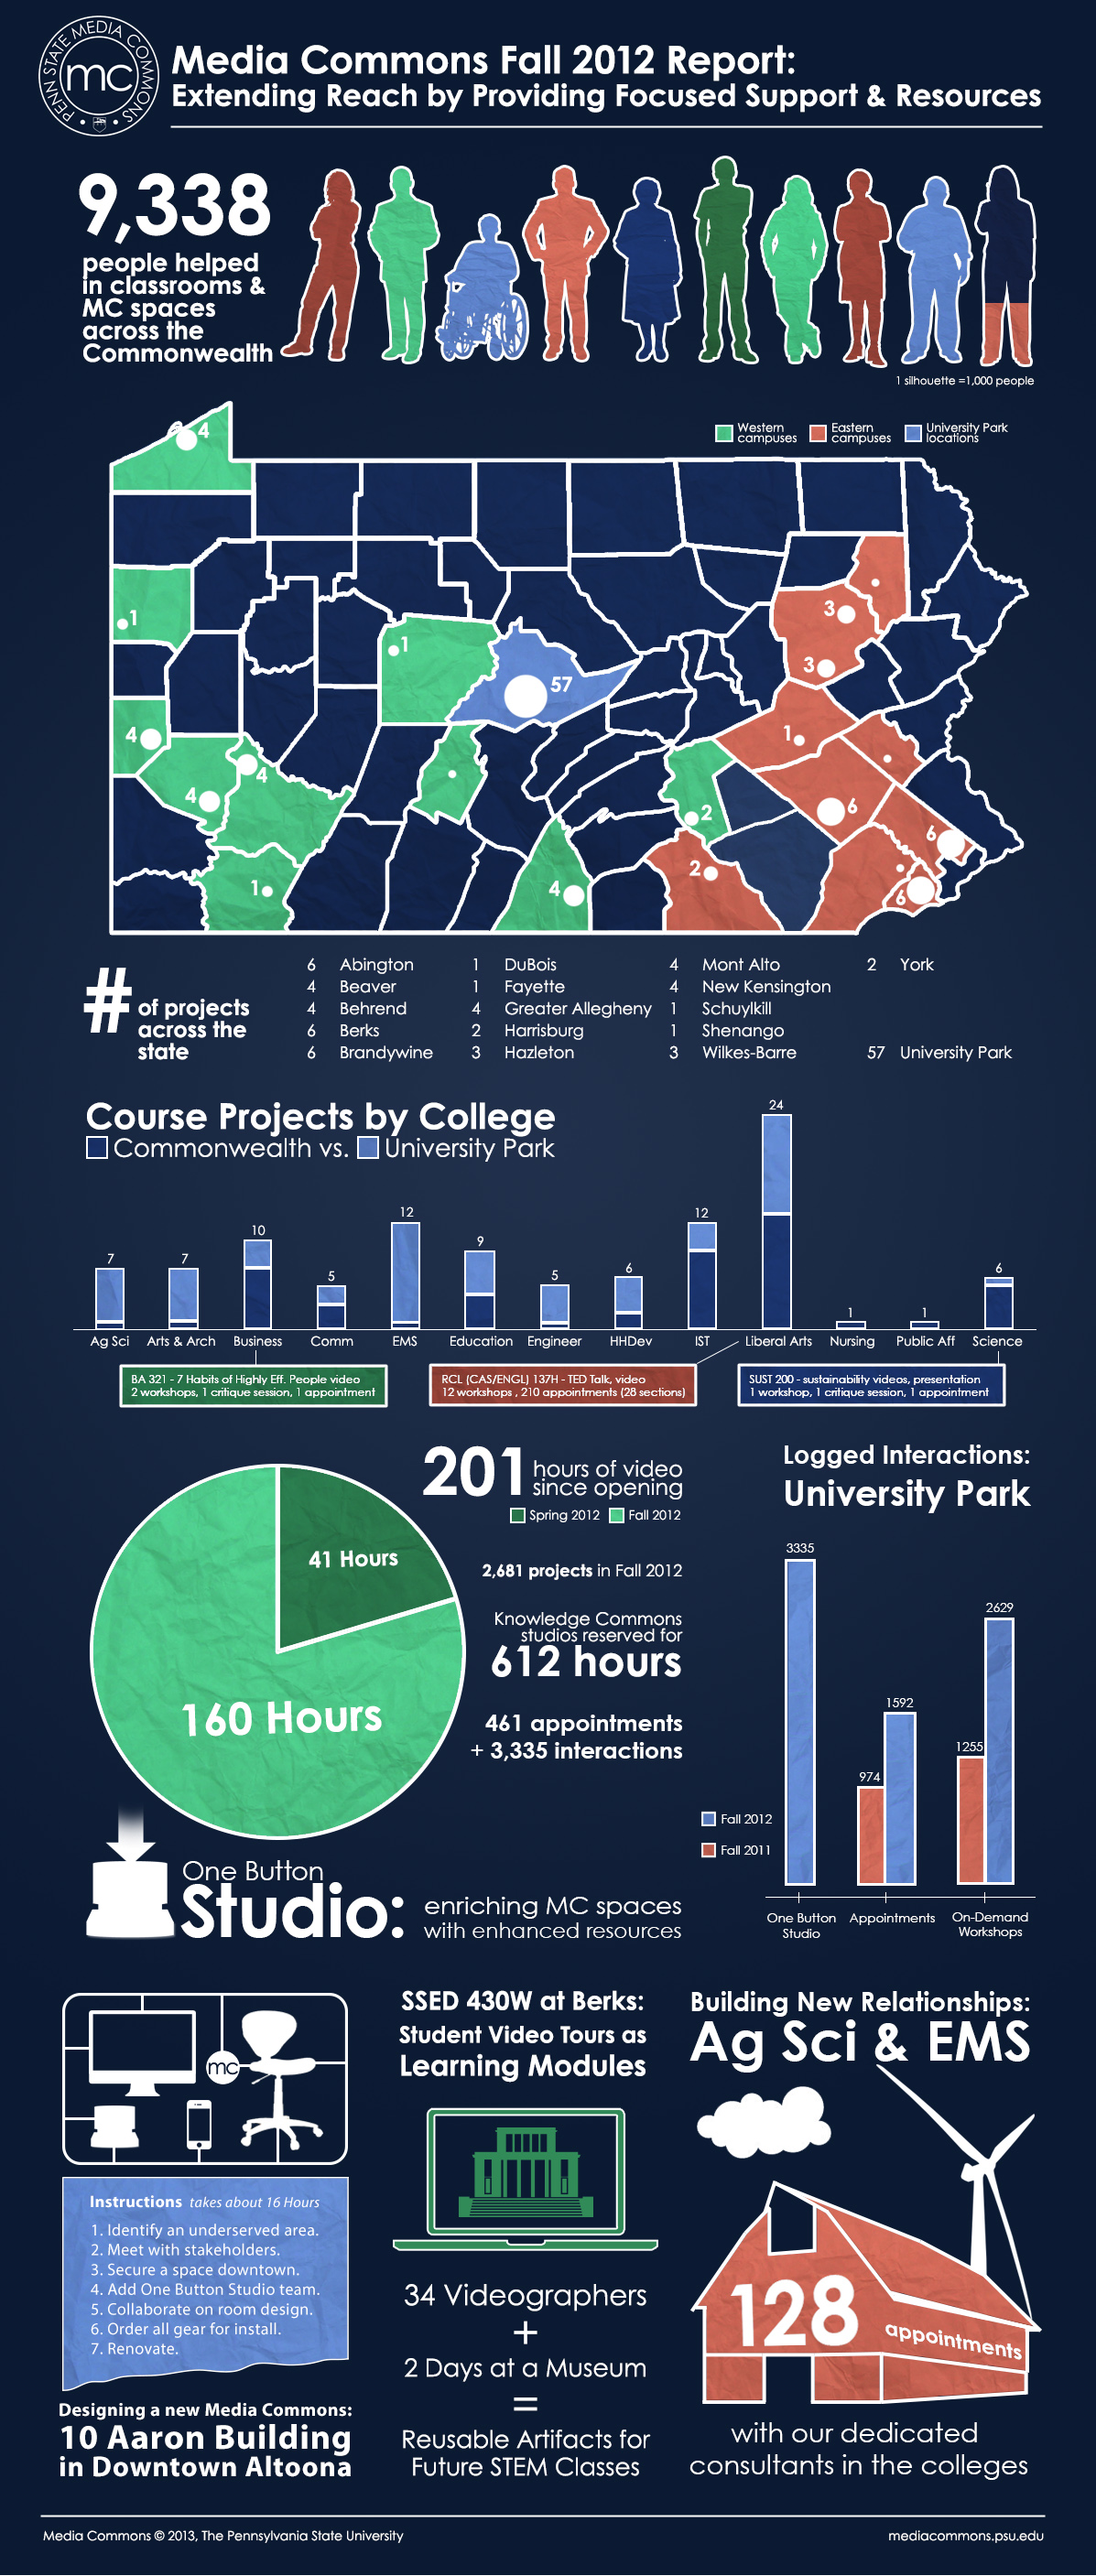 Fall 2012 Infographic
-
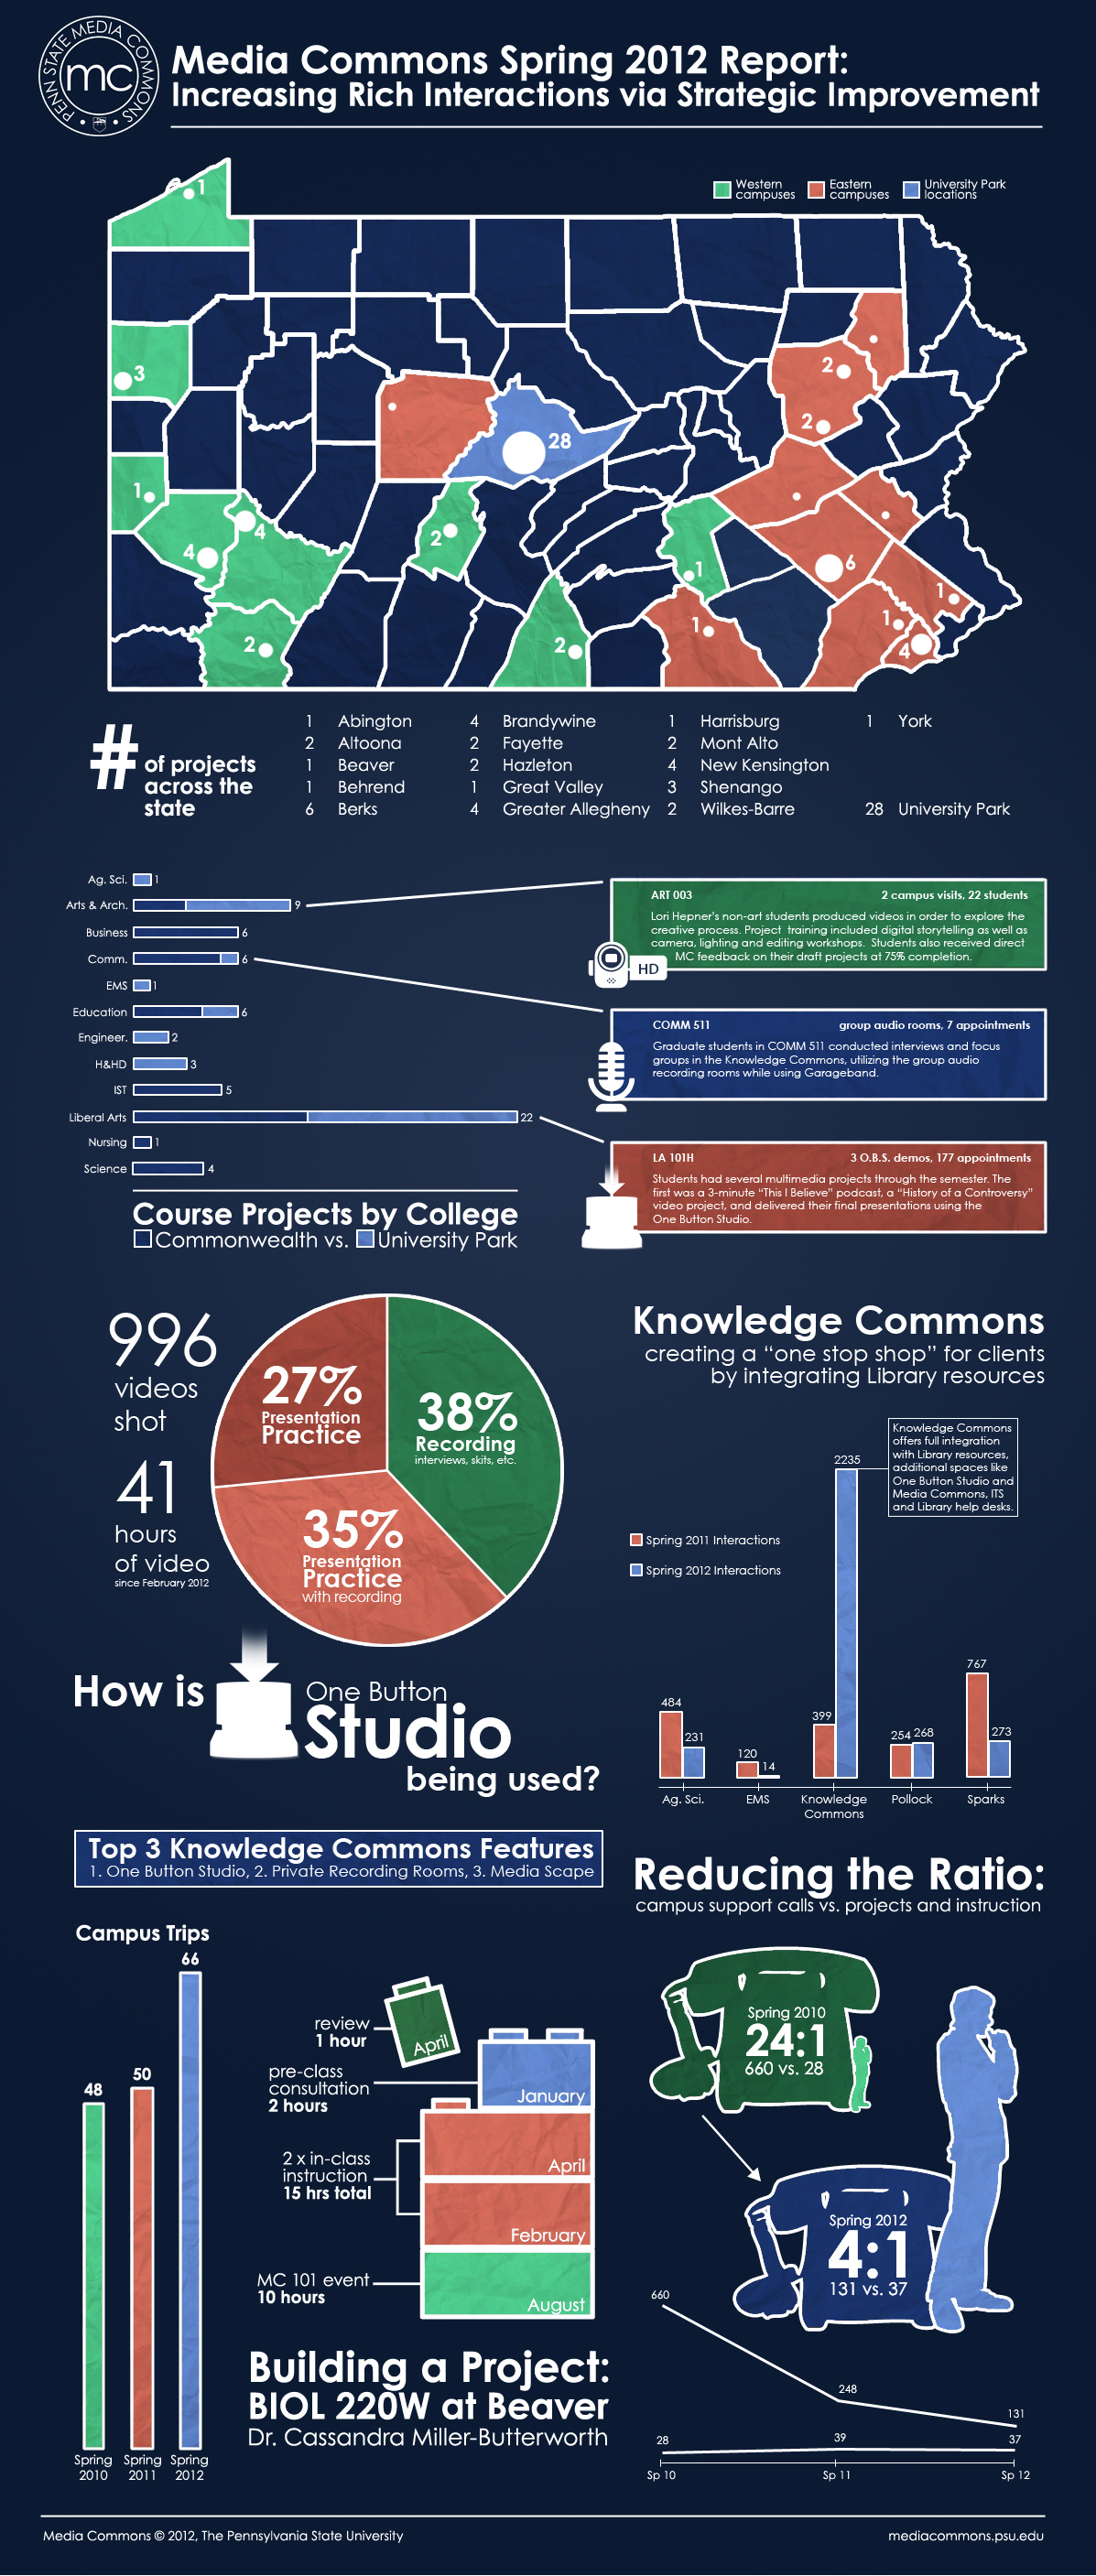 Spring 2012 Infographic
-
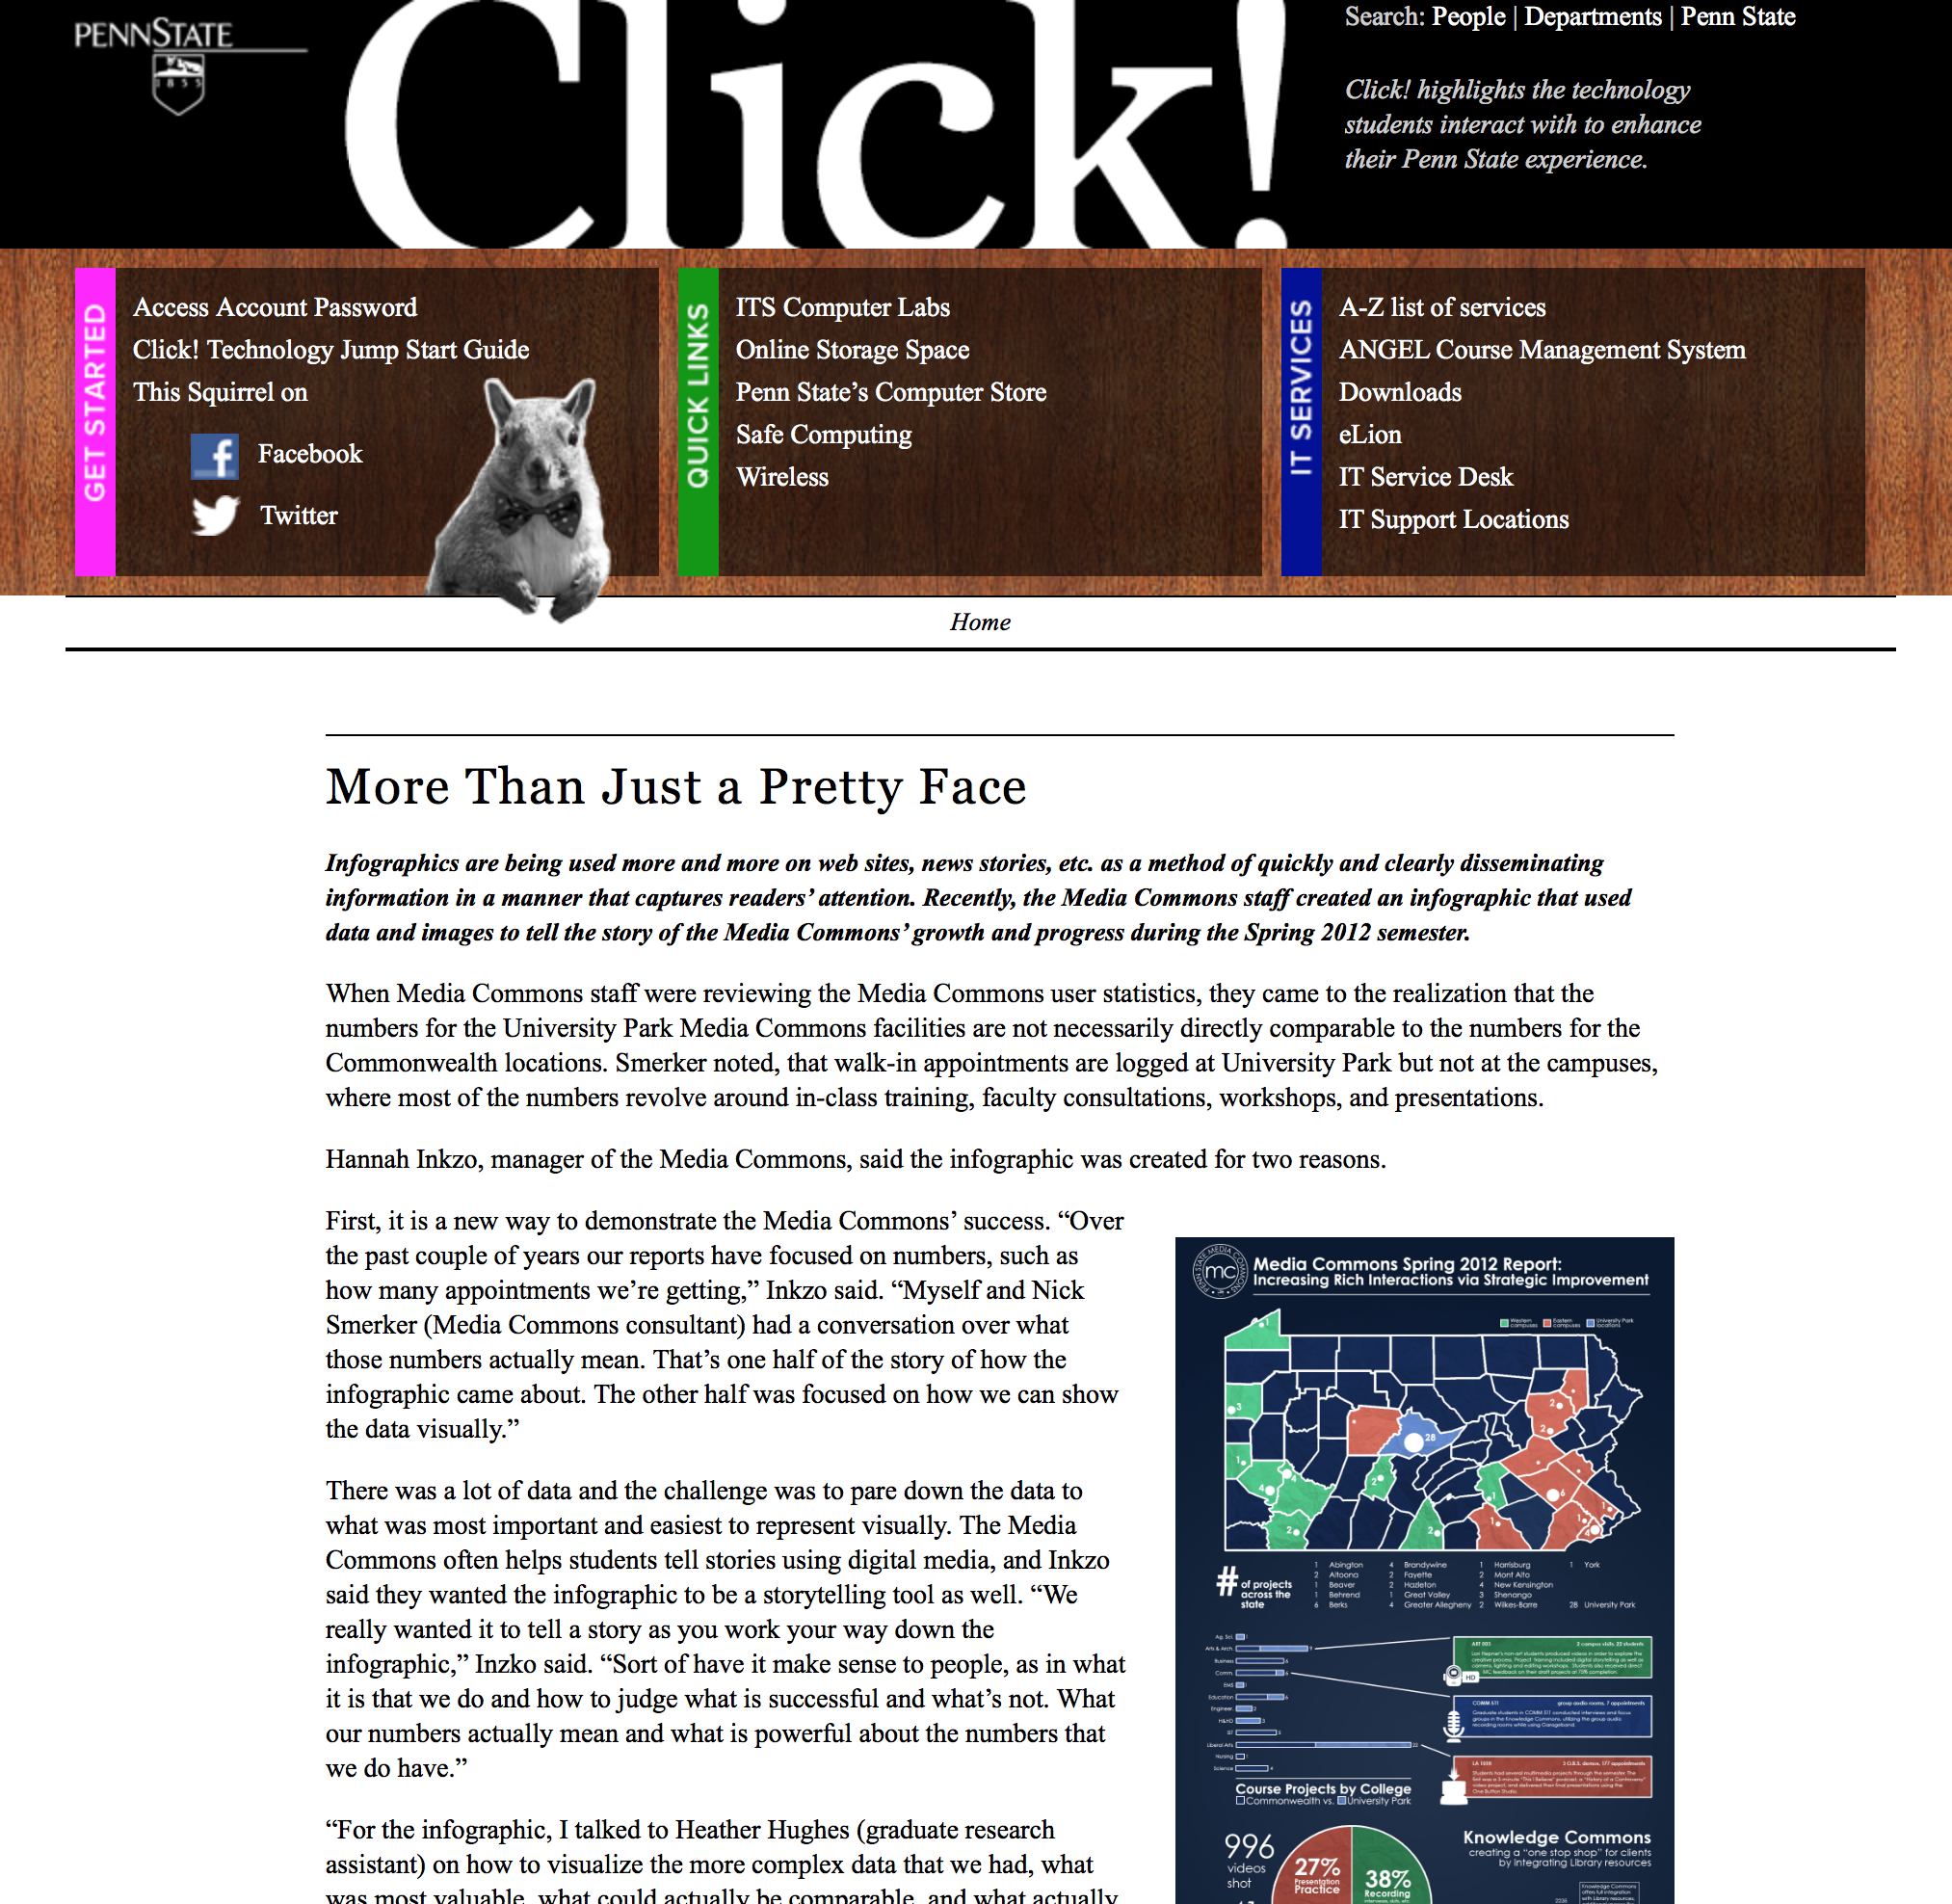 Infographics Article – Click!
Semester Infographics
Media Commons reports have always been internal information. In moving towards a publicly shared report, I wanted to not only provide an easily-read summary but also a “magazine cover” that graphically explained the key trends for the semester, at a glance. This infographic format was created through consultation with a data visualization expert and has been refined iteratively each semester, recently through collaboration with a mentored team.
- Category
- Information Design
- Skills
- collaboration, communication, community building, graphic design, information synthesis
- Project URL
- Infographics + Semester Reports